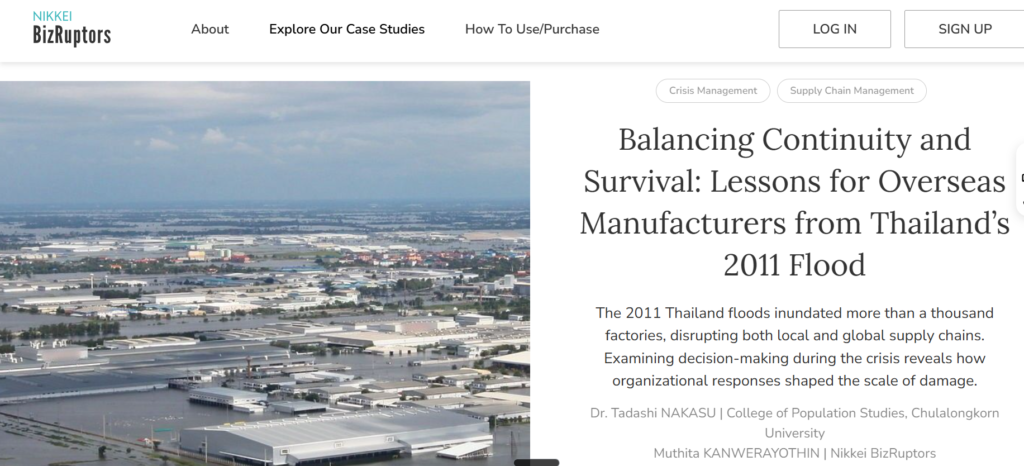
Balancing Continuity and Survival: Lessons for Overseas Manufacturers from Thailand’s 2001 Flood

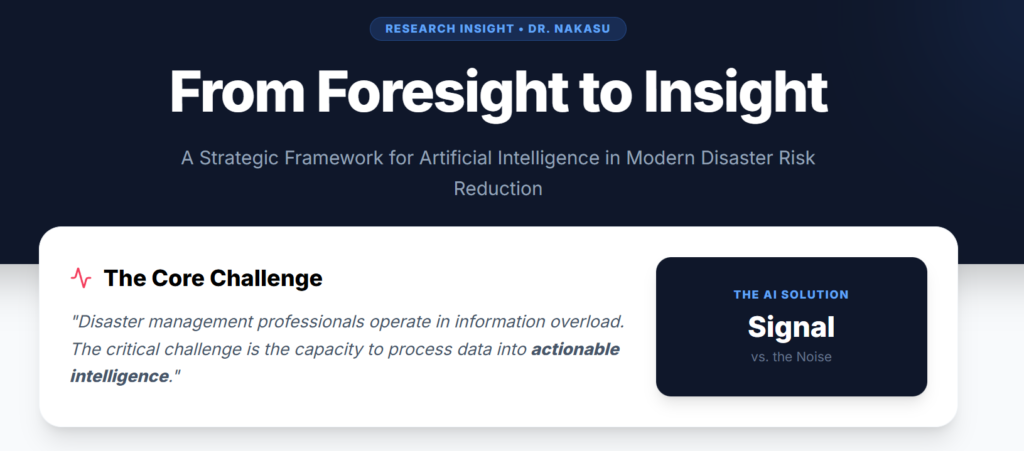
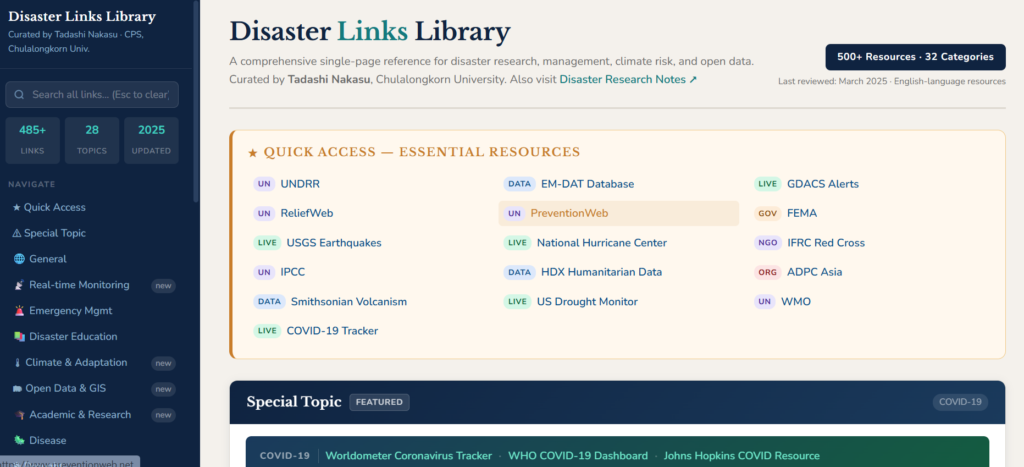
The infographic of the AI-Integrated Disaster Preparedness Platforms is shown as an infographic: AI-Integrated Disaster Preparedness Platforms

The infographic of the demography and public policy seminar, one example slide, is shown as an infographic: https://disasters.weblike.jp/IVDV_Relationship%20v1.html
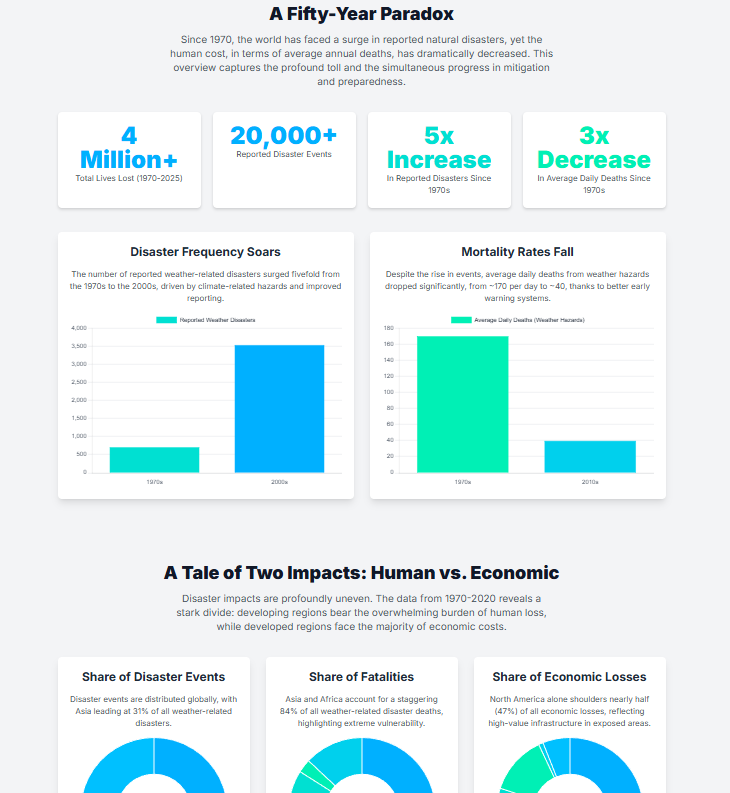
The infographic of the global trends of disasters (1970-2025) is shown as an infographic: https://disasters.weblike.jp/global%20trends.html
The website of the logistic regression analysis in the demography and public policy seminar. Created one of the simplest and easiest-to-understand websites.

website:https://disasters.weblike.jp/logistic%20regression%20overview.html

The infographic of the 1985 Mexico City Earthquake, mainly focusing on the social factors with earthquake characteristics, is shown as an infographic: http://disasters.weblike.jp/mexico%20infogr.html
The distance impact reminded me of the situation in Bangkok when an earthquake occurred in Myanmar in April 2025.
You cannot copy content of this page