Category Archives: Earthquake

【Disaster Research:Excel】Regression Analysis

Step-by-Step Guide for Excel Regression Analysis

1. Prepare Your Dataset in Excel

Dataset Overview:
Create an Excel file (e.g., DisasterData.xlsx) with the following columns and sample data:

Objective:
Use the earthquake magnitude (independent variable) to predict economic loss (dependent variable: MN USD) through simple linear regression.

2. Enable the Analysis ToolPak

Excel’s Data Analysis ToolPak is required for regression analysis. If it’s not already enabled:

  1. Click on File > Options.
  2. Select Add-Ins.
  3. In the Manage box at the bottom, select Excel Add-ins and click Go.
  4. Check Analysis ToolPak and click OK.

3. Visualize the Data

Before running the regression, it’s helpful to visualize the relationship:

  1. Select the columns Earthquake_Magnitude and Economic_Loss (excluding the header if desired).
  2. Go to the Insert tab.
  3. Choose Scatter from the Charts group and select the basic scatter plot.

This chart helps you see if there’s a linear trend between the two variables.

4. Conduct the Regression Analysis

  1. Go to the Data tab and click Data Analysis (in the Analysis group).
  2. In the Data Analysis dialog, select Regression and click OK.
  3. Input Y Range:
    • Select the range for the dependent variable (Economic_Loss). For example, if Economic_Loss is in column C from row 2 to row 16, enter C2:C16.
  4. Input X Range:
    • Select the range for the independent variable (Earthquake_Magnitude). For example, B2:B16.
  5. If your data has headers, check the Labels box.
  6. Choose an Output Range where you want the results to appear (or select a New Worksheet Ply).
  7. Click OK.

5. Interpret the Regression Output

Excel will generate a regression output that includes several key pieces of information:

  • Coefficients:
    • Intercept: The expected value of Economic_Loss when Earthquake_Magnitude is zero.
    • X Variable 1 (Slope): The change in Economic_Loss for each one-unit increase in Earthquake_Magnitude.
  • R-squared:
    • Indicates how much of the variance in Economic_Loss is explained by Earthquake_Magnitude. A value closer to 1 indicates a better fit.
  • p-Value:
    • Helps determine the statistical significance of the model. A low p-value (typically less than 0.05) suggests that the relationship is significant.

6. Use the Regression Model for Predictions

Once you have the coefficient and intercept from the output, you can create a prediction formula:

Y=(slope)X+(intercept) Y:Economic_Loss X:Earthquake_Magnitude

<Interpretation for beginners>

  1. Regression Statistics

Multiple R (Correlation Coefficient):

  • Value: 0.964775
  • Meaning: This measures how strongly two variables (in this case, Earthquake_Magnitude and Economic_Loss) are related. A value close to 1 indicates a very strong linear relationship.

R Square (Coefficient of Determination):

  • Value: 0.930791
  • Meaning: About 93% of the variation in the Economic_Loss can be explained by the Earthquake_Magnitude. This is considered a high value, indicating the model fits the data well.

Adjusted R Square:

  • Value: 0.925467
  • Meaning: This is a slightly adjusted version of R Square that takes into account the number of explanatory variables and the sample size. Because this is a simple linear regression with only one explanatory variable, the Adjusted R Square is still very close to the R Square value.

Standard Error:

  • Value: 9.409751
  • Meaning: On average, the model’s predictions of Economic_Loss deviate from the actual observed values by about 9.41 units (likely millions of dollars if your data is in that unit). The lower this number, the more precise the model’s predictions tend to be.

Observations:

  • Value: 15
  • Meaning: The total number of data points (earthquake events) used in the analysis.
  1. ANOVA (Analysis of Variance) Table

The ANOVA table helps you see how much of the total variation in Economic_Loss is explained by the regression (model) versus how much is left unexplained (residual).

df (Degrees of Freedom):

  • Regression df: 1 (one explanatory variable)
  • Residual df: 13 (the remainder)
  • Total df: 14 (because 15 data points minus 1)

SS (Sum of Squares):

  • Regression SS: 15480.54
  • Residual SS: 1151.064
  • Total SS: 16631.6
  • Meaning: The total SS (16631.6) is split between the portion explained by the model (15480.54) and the unexplained portion (1151.064). Since the regression SS is much larger than the residual SS, the model explains most of the variation.

MS (Mean Square):

  • Regression MS: 15480.54 (because the Regression SS is divided by 1, the df for regression)
  • Residual MS: 88.5432 (because 1151.064 is divided by 13)

F and Significance F (p-value for the overall model):

  • F: 174.835
  • Significance F: 6.44E-07 (which is 0.000000644)
  • Meaning: A very low p-value indicates that the overall regression model is statistically significant. In other words, Earthquake_Magnitude has a statistically significant effect on Economic_Loss.
  1. Coefficients Table

This table provides information about the intercept and the slope of your regression line.

Intercept (Coefficient):

  • Value: -152.261
  • Standard Error: 14.936
  • t Stat: -10.193
  • P-value: 1.47E-07
  • Lower 95%: -184.529
  • Upper 95%: -119.994
  • Meaning:
      • The intercept is the predicted Economic_Loss when Earthquake_Magnitude is 0. Mathematically, it’s part of the best-fit line. Although a negative intercept doesn’t make real-world sense for something like “loss” (you can’t have negative loss), it’s a valid outcome in a simple linear model.
      • The very small p-value (< 0.05) indicates the intercept is statistically different from zero.

Earthquake_Magnitude (Coefficient):

  • Value: 28.6965
  • Standard Error: 2.123497
  • t Stat: 13.513
  • P-value: 6.44E-07
  • Lower 95%: 23.865
  • Upper 95%: 33.528
  • Meaning:
      • For each 1-unit increase in Earthquake_Magnitude, the model predicts an increase of about 28.70 in Economic_Loss (again, presumably in millions of dollars).
      • The very small p-value (< 0.05) shows that Earthquake_Magnitude is a statistically significant predictor of Economic_Loss.
      • The 95% confidence interval (23.865 to 33.528) means we are 95% confident the true slope lies between these values.
  1. Putting It All Together

Regression Equation:

Predicted Economic Loss=−152.261+(28.6965×Earthquake Magnitude)

  1. Interpretation of R Square (0.930791):
    • About 93% of the variation in Economic_Loss is explained by the variation in Earthquake_Magnitude. This suggests a strong linear relationship.
  2. Model Significance (Significance F and p-values):
    • The overall model is highly significant (p < 0.001).
    • Earthquake_Magnitude is a very strong predictor (p < 0.001).
  3. Practical Meaning:
    • As the earthquake magnitude increases, expected economic losses rise substantially. Even though the intercept is negative (which is not realistic in a real-world scenario), the main takeaway is the slope: larger earthquakes lead to significantly higher losses.
  4. Model Limitations:
  • This is a simple linear model using only one predictor (Earthquake_Magnitude). Real-world economic loss is influenced by many factors (e.g., population density, building codes, depth of the quake, location, etc.).
  • The model’s negative intercept highlights that while it fits the data well for the range of magnitudes observed, it may not be meaningful for magnitudes far outside that range.
  1. Final Tips for Beginners
  • Always Plot Your Data: A scatter plot of Earthquake_Magnitude vs. Economic_Loss can confirm if a linear trend is reasonable.
  • Check Residuals: Look at how well the model performs across all data points. If there’s a clear pattern in the residuals, the linear model might not be appropriate.
  • Real-World Context: Negative intercepts can appear in purely statistical models but might not have a direct real-world meaning. Always interpret results carefully.
  • Add More Variables: If you suspect other factors affect Economic_Loss, consider multiple regression in the future to improve your model’s accuracy.

In summary, these regression results show a strong linear relationship between Earthquake_Magnitude and Economic_Loss. The model explains about 93% of the variation in economic losses, and both the intercept and the slope are statistically significant. However, as with any statistical model, interpret the results with caution and consider real-world factors that may affect the outcome beyond just magnitude.

【Disaster Research】ADRC: Kobe’s Legacy in Asian Disaster Risk Reduction

From Tragedy to Leadership: The Birth of ADRC

The Asian Disaster Reduction Center (ADRC) was established in 1998 following the devastating Great Hanshin-Awaji Earthquake (commonly known as the Kobe Earthquake) that struck Japan in 1995. This catastrophic event became a catalyst for change, transforming how Japan—and later Asia—approached disaster management and resilience.

Kobe’s Remarkable Recovery Journey

Kobe’s recovery story stands as a powerful testament to resilience and strategic rebuilding. Within just 9 years after the earthquake, Kobe’s population returned to pre-disaster levels—an extraordinary achievement considering the scale of destruction. This recovery wasn’t merely about rebuilding structures but reimagining the city’s future role.

HAT Kobe: A Hub for Disaster Reduction Excellence

Today, Kobe has reinvented itself as a global center for disaster reduction policies and activities. The area known as HAT Kobe hosts numerous disaster-related organizations, including ADRC. The name “HAT” carries dual significance:

  • It stands for “Happy and Active Town”
  • In Japanese, “hatto” (ハッと) means “surprised” or “sudden realization”

This wordplay perfectly captures Kobe’s transformation from a disaster-struck city to a knowledge hub that helps others prepare for and respond to unexpected disasters.

Learning From Kobe: A Model for Disaster Recovery

Kobe’s recovery process offers valuable lessons for communities worldwide facing similar challenges. The city demonstrates how effective post-disaster planning can transform tragedy into opportunity, creating not just infrastructure but institutional knowledge that benefits others.

ADRC’s Mission Across Asia

ADRC plays a vital role in sharing disaster reduction expertise with its member countries throughout Asia. The organization:

  • Contributes to disaster reduction policy development
  • Supports member countries in implementing effective disaster management systems
  • Facilitates knowledge sharing through detailed country reports
  • Monitors and reports on ongoing disaster situations

Resources for Disaster Management Professionals

ADRC maintains comprehensive resources that disaster management professionals can access:

These resources provide valuable insights into regional disaster management systems, country-specific approaches, and up-to-date information on current disaster situations across Asia.

Building Regional Resilience Together

Through organizations like ADRC and the example set by Kobe, Asian countries are developing stronger collaborative approaches to disaster risk reduction. By learning from past experiences and sharing knowledge, communities across the region are better prepared to face future challenges with resilience and determination.

Day_196 : The Matsushiro Earthquake Center

The following is a reprint of a column I once wrote:

The Matsushiro Earthquake Center, nestled in the historic town of Matsushiro within Nagano Prefecture, represents a pivotal chapter in Japan’s approach to seismic research and disaster mitigation. Established in February 1967 under the auspices of the Japan Meteorological Agency’s Seismological Observatory, this institution was born out of a critical period marked by intense seismic activity. Between August 3, 1965, and April 17, 1966, the region experienced a staggering 6,780 seismic events, ranging from imperceptible tremors to significant quakes measuring intensity 5 and 4 on the Japanese scale. This unprecedented series of earthquakes not only posed a major societal challenge but also catalyzed the center’s founding.

The initiative to establish the center was strongly influenced by the then-mayor of Matsushiro, Nakamura, who famously prioritized the pursuit of knowledge and research over material wealth. This sentiment laid the groundwork for what would become a crucial site for earthquake prediction and disaster preparedness efforts, situated on the historical grounds of the Imperial Headquarters.

Drawing from my experience at the Natural Disaster Information Office and in collaboration with the Precise Earthquake Observation Office of the Japan Meteorological Agency (now known as the Matsushiro Earthquake Observatory), I have had the unique opportunity to organize and delve into discussions from that era. Despite being born after the seismic events in Matsushiro, I find the archival records fascinating. They not only recount the collective efforts of Matsushiro’s residents to forge a disaster-resilient community in the aftermath of the earthquake but also highlight the comprehensive nature of the research conducted.

The inquiries extended beyond seismic analysis, encompassing a holistic examination of the earthquake’s impact on the community. Noteworthy is the health survey conducted on students from a local school, in collaboration with the Matsushiro Health Center and hospital, to assess the psychological and physical effects of the seismic swarms. Moreover, the scope of investigation included studies on earthquake-induced landslides and the repercussions on water infrastructure, showcasing the multifaceted response from various experts and frontline workers of the time.

This rich tapestry of collective memory and scientific inquiry underscores the enduring spirit of Matsushiro—a community united in its commitment to disaster resilience, informed by the lessons of its past.

Ref.

http://researchmap.jp/read0139271/%E7%A0%94%E7%A9%B6%E3%83%96%E3%83%AD%E3%82%B0/

Day_58: Asian Disaster Reduction Center (ADRC) and Kobe Earthquake

ADRC is established in 1998 after the Kobe Earthquake. Kobe city’s population had caught up the same level before the disaster in 9 years. Kobe reinvents itself as a center of disaster reduction policies and activities in the world. There are so many disaster-related organizations in HAT Kobe. The HAT means “Happy and Active” and also “surprised” in Japanese. This is a good example to refer to for the disaster recovery process. We can learn the lessons from Kobe. ADRC contributes to disaster reduction policies and activities for member countries in Asia. We can check member countries disaster management systems, country reports, and others. We can also confirm the updated disasters on the ADRC’s website.

*ADRC member countries information site.

http://www.adrc.asia/disaster/index.php

** Disaster Information
http://www.adrc.asia/latest/index.php

Day_83 : Tsunami – the words

80% ofall tsunamis occurring in the world are concentrated in the Circum-Pacific Belt.The leading countries researching the tsunami are Japan, the U.S., and Russia. The tsunami is originally a Japanese term that means a high tidal wave. The name was used by Japanese immigrants during a tidal wave caused by the 1946 Aleutian Islands earthquake (tsunami) hit in Hiro, Hawaii and it became an international word, especially an academic word, ”Tsunami”. The International Union of Geodesy and Geophysics (IUGG) is in charge of a tsunami session at the start of an international conference about tsunamis. “Tsunami” became public after the 2004 Indian Ocean Tsunami disaster.

*The word “tsunami” is composed of the Japanese words “Tsu” (which means harbor) and “Nami” (which means “wave”)(ITIC)

The 1946 Aleutian Islands earthquake
Hiro, 1964

***Pacific Tsunami Museum in Hiro

Day_204 : The story of the Great Kanto Earthquake of 1923, which set the cities of Tokyo and Yokohama on fire

When an earthquake strikes, fires start simultaneously in many places. The combination of dispersed firefighters’ ability to extinguish fires, broken buildings and unusable roads, broken water supplies and water shortages, and congested roads with many cars makes it very difficult to extinguish fires. For these reasons, large-town fires are more likely to occur during earthquakes. This is especially true in wet areas like Japan, where buildings are mainly made of wood and fires can spread over them as they break down, causing more damage. In dry areas, many houses are made of brick or stone, which are often completely destroyed by earthquakes.

During the Great Kanto Earthquake of 1923, 320,000 houses, or about 62% of the houses in Tokyo, were burned down. There were 136 fires, 76 of which spread widely, burning as much as 44% of the city in three days. Almost all (95%) of the deaths were caused by fire. Almost the same proportion (63%) of houses burned down in Yokohama. History shows that every time there has been a major earthquake, there has also been a major fire. The basic measure against fires caused by earthquakes is to make the house earthquake-proof and prevent it from collapsing.


source:
https://dil.bosai.go.jp/workshop/2006workshop/gakusyukai11.html

Day_129 : Natural Disasters in China (1) – Two Earthquake Disasters

Overviews

The overviews of Natural Disasters in China are the followings:

1) Death numbers
death_china2
Source: EM-DAT

2) Affected numbers
affected_china
Source: EM-DAT

3) Damage costs
damage_china
Source: EM-DAT

Natural disasters in China are very large scales, reflecting country’s population and geographical size. Also, we need to know that China has a rapidly growing economy. We can confirm the normal historical trends of natural disasters, from human sufferings to economic damages, which this note already mentioned (Day 77). For instance, the top 10 deadliest natural disasters in China are all before 1970s. On the contrary, the top 10 costliest natural disasters in China all occurred after 1990s.

Two Earthquakes
Yang Zhang William Drake et al. (2016)* indicate interesting views on two earthquake disaster recoveries: the 1976 Tangshan earthquake and the 2008 Wenchuan earthquake. The point is why the 2008 Wenchuan earthquake recovery was so rapid compared to the 1976 earthquake.
However, the paper could add the total background changes in China, such as the economy and politics. China has changed dramatically since 1976, from historical viewpoints.

A comparison of the two earthquakes will be explained.

Yang Zhang William Drake et al. (2016), Disaster Recovery Planning after Two Catastrophes: The 1976 Tangshan Earthquake and the 2008 Wenchuan Earthquake, International Journal of Mass Emergencies and Disasters, 34(2):174–200.

Day_203 : Distant Tsunamis Triggered by Massive Earthquakes: The 1960 Chilean Earthquake and the 2004 Indian Ocean Tsunami

On the early morning of May 23, 1960, a massive earthquake, the largest ever recorded with a magnitude of 9.5, struck southern Chile. This earthquake unleashed a tsunami that swiftly crossed the Pacific Ocean, reaching the Japanese coast about 22.5 hours later. The tsunami, which surged up to 8 meters high, resulted in 139 deaths and caused the destruction or displacement of 2,830 buildings across Japan. Due to the geographical position of Chile opposite Japan, the tsunami’s impact was more pronounced upon reaching the Japanese shores. These distant tsunamis are particularly challenging to forecast since they occur without the preliminary tremors typically associated with earthquakes. Consequently, regions prone to seismic activity, particularly around the Pacific, including Hawaii, have established early warning systems.

Day_168 : Past Interview Records – PTWC (Pacific Tsunami Warning Center) in Hawaii (1)


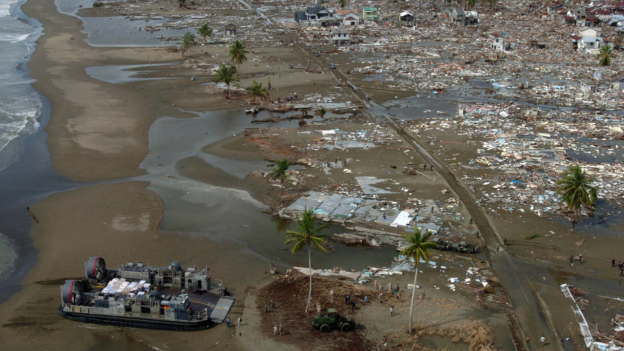
In 2004, the Indian Ocean was struck by another significant earthquake, which triggered a devastating tsunami. At that time, the absence of a tsunami warning system in the Indian Ocean contributed to a staggering death toll of 300,000. The effectiveness of tsunami warnings is limited by their ability to reach extensive coastal areas promptly. Therefore, it is crucial for residents to be aware of their local environmental characteristics and rely on personal judgment and preparedness to mitigate the risks posed by tsunamis.

Day_200 : High-Speed Tsunamis and Delayed Warnings: The Urgency of Evacuation during the 1896 Meiji Sanriku, 1933 Showa Sanriku, and 2011 Great East Japan Earthquake and Tsunamis

Large tsunamis are caused by significant earthquakes of magnitude eight or greater. In particular, such earthquakes frequently occur along the Pacific coast of Hokkaido and Tohoku in Japan. The Sanriku coast in this region has a unique shape called a “rias coast,” which is prone to tsunamis. In the 1896 Meiji Sanriku tsunami, the tsunami reached a height of 38 meters and killed about 22,000 people. Thirty-seven years later, in 1933, another major tsunami, the Showa Sanriku tsunami, struck the region, killing approximately 3,000 people. 2011’s Great East Japan Earthquake and Tsunami did not fully apply the lessons of the past, leaving approximately 18,000 people dead or missing.

The time between an earthquake and a tsunami reaching the coast is very short, from 5 to 10 minutes. Running to higher ground quickly is almost the only way to protect yourself from a tsunami. The tsunami will reach the coast where it is the highest and also get to the coast the fastest. Therefore, instead of waiting for information from the outside, it is essential to have knowledge about tsunamis, understand your surroundings, and act on your judgment.

Contents (in Japanese)
Source: URL:https://dil.bosai.go.jp/workshop/2006workshop/gakusyukai21.html

Day_198 : Characteristics of Earthquake Disasters

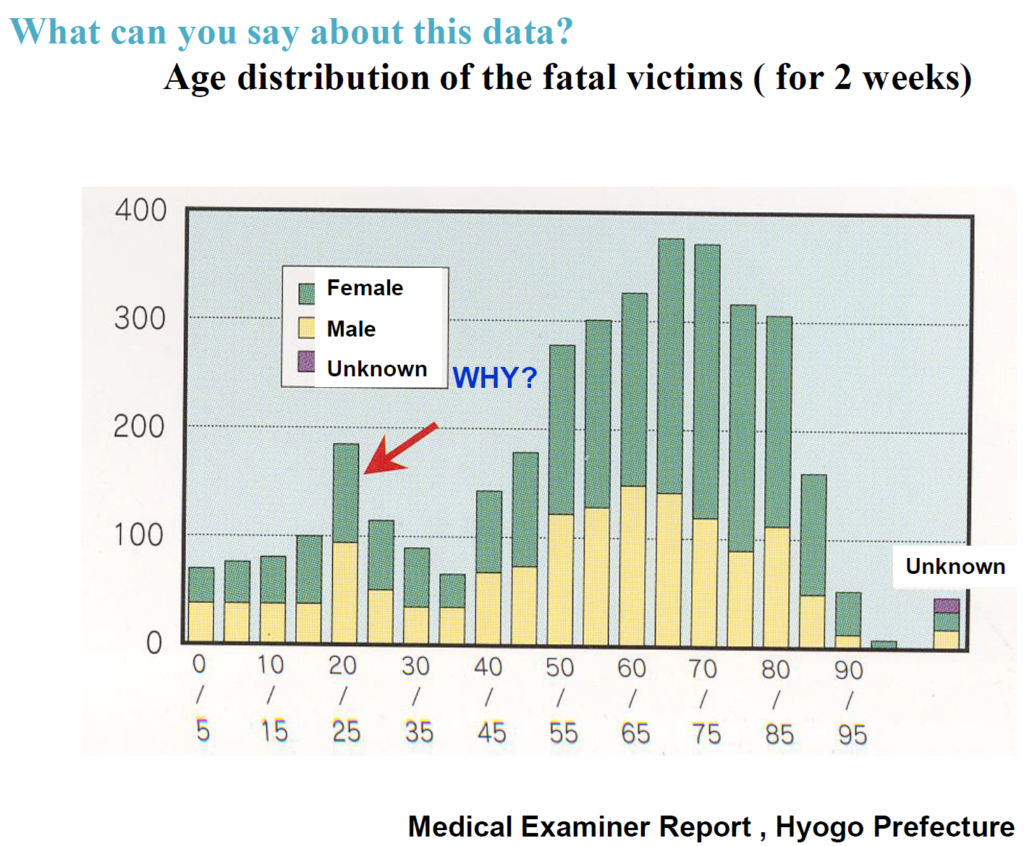
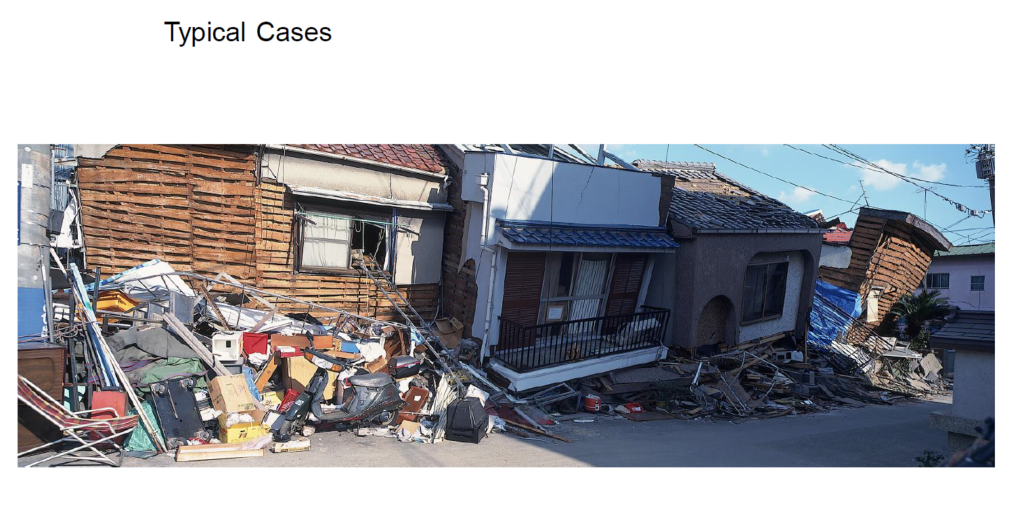
In most cases, when a strong earthquake occurs, many people die as buildings collapse. For example, in the Kobe earthquake, more than 90% of the 5,000 people who died lost their lives within 15 minutes immediately after the quake. For this reason, it is essential to build buildings well to reduce the number of people who die in earthquakes. This will prevent fires, make it less likely that people will lose their homes and become permanent refugees, and reduce the problems of relief and rebuilding.

In developing countries, especially in arid and semi-arid regions, earthquakes cause many deaths. In such areas, sun-dried bricks called “adobe” are common building materials, and buildings made of these bricks often collapse easily in earthquakes, burying many people alive. In developing countries, for economic reasons, standards for building earthquake-resistant buildings are usually low, and construction is often inadequate. Therefore, even earthquakes that are not strong can easily cause severe damage. In addition, in regions with many wooden houses, such as Central America and Southeast Asia, buildings can collapse and catch fire.