Let’s learn about disaster risk reduction in Pacific Island countries.
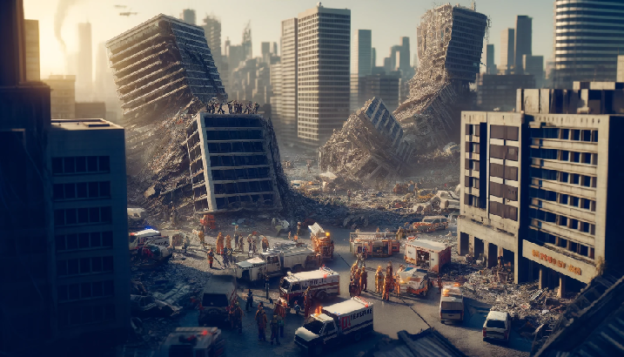
For Pacific Island countries (PICs), which are vulnerable to climate change and natural disasters, including tropical cyclones, earthquakes, tsunamis, and volcanic eruptions, disaster risk reduction (DRR) is a crucial part of sustainable development. These occurrences could severely impact the environment, the local economy, and the local communities. It is now more crucial than ever for PICs to concentrate on improving their capacity for disaster risk reduction and resilience.
The concept and practice of disaster risk reduction (DRR) are described by the United Nations Office for Disaster Risk Reduction (UNDRR) as “the concept and practice of reducing disaster risks through systematic efforts to analyze and manage the causal factors of disasters, including through reduced exposure to hazards, lessened vulnerability of people and property, wise management of land and the environment, and improved preparedness for adverse events.” This entails comprehending the particular difficulties that PICs confront in the Pacific region, figuring out the best ways to deal with these difficulties, and cooperating to secure a more resilient future for everyone.
This article discusses how crucial disaster risk reduction is for the Pacific region, looks at essential tactics for improving DRR, looks at examples of effective programs, and thinks about how local knowledge and global cooperation may help create a resilient culture. Pacific Island countries may lessen their susceptibility, promote sustainable development, and be better prepared for future calamities by implementing these measures.
Pacific Island countries face distinct challenges that are unique to their region.
Pacific Island countries have many specific difficulties when it comes to reducing the risk of disasters. First and foremost, they are particularly vulnerable to disasters because of their location. PICs are vulnerable to volcanic eruptions, earthquakes, and tsunamis because of their location along the Pacific Ring of Fire. The area is also frequently affected by tropical cyclones, which can result in extensive harm and destruction.
PICs’ low resources, disaster preparedness, and response capacity present another critical obstacle. Many of these nations’ inhabitants, infrastructure, and financial resources are modest. As a result, they frequently struggle to create and keep up with the required structures and methods for efficient disaster risk reduction.
Additionally, the effects of climate change are increasing already-existing threats and developing new ones for Pacific Island nations. Natural disasters are becoming more frequent and severe in the area due to rising sea levels, rising temperatures, and altering weather patterns. This makes improving disaster risk reduction in the Pacific much more complex and urgent.
Reducing the risk of disasters in the Pacific region is paramount.
It is impossible to exaggerate the significance of disaster risk reduction in the region of the Pacific. Natural disasters can wreak havoc and create great destruction, affecting the environment, the economy, and communities that persist for years. The Pacific island countries can lessen these effects, save lives, and safeguard their development achievements by investing in disaster risk reduction.
The Pacific region’s Sustainable Development Goals (SDGs) are also strongly related to disaster risk reduction. Natural disasters can directly influence many SDGs, including eradicating poverty, ensuring health and well-being, and fostering sustainable cities and communities. Pacific Island countries may advance toward these objectives and guarantee a more sustainable future for all by improving their capacity for disaster risk reduction.
Finally, reducing the risk of disasters is essential to helping Pacific Island communities become resilient. Communities’ capacity to resist shocks and pressures like disasters, recover from them, and adapt to them is called resilience. By implementing efficient disaster risk reduction initiatives, PICs may empower their communities to increase their resilience and preparedness for future catastrophes.
Discover some highly effective techniques to enhance disaster risk reduction with the following suggestions:.
Climate change adaptation
The effects of climate change are one of the biggest obstacles to disaster risk reduction that Pacific Island countries must overcome. As a result, any DRR strategy in the area must include adaptation to climate change as a critical element. Some examples of adaptation methods are enhancing coastal defenses, implementing sustainable land- and water-management practices, and creating climate-resilient agriculture and fisheries.
Climate factors must be incorporated into development planning and decision-making processes as part of climate change adaptation. This can help ensure that investments and development initiatives are created to resist climate change’s effects and not unintentionally raise the risk of disaster.
Infrastructure resilience
Improving infrastructure resilience is crucial for boosting disaster risk reduction in the Pacific. This entails ensuring that critical infrastructure, such as transportation networks, energy production facilities, and water and sanitation systems, is planned, constructed, and maintained to withstand the effects of natural disasters and climate change.
Developing and enforcing construction rules and standards, using cutting-edge technologies and materials, and integrating risk assessments and management strategies into the planning and design processes for infrastructure are all ways to increase its resilience. Pacific Island countries can lessen the potential harm brought on by disasters and assure the ongoing provision of critical services both during and after disasters by investing in resilient infrastructure.
Early warning systems
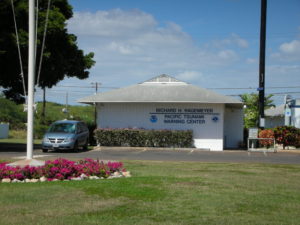
Implementing efficient early warning systems is paramount in enhancing disaster risk reduction efforts in the Pacific region. The aforementioned systems can provide precise and prompt data regarding imminent perils, enabling communities and governing bodies to undertake suitable measures to mitigate the consequences of disasters.
Early warning systems encompass a variety of technologies and methodologies, including but not limited to satellite-based monitoring, seismometers, and community-based observation networks. Apart from the development and execution of stated systems, it is crucial to guarantee that communities possess the ability and knowledge to understand and respond to early warning information.
Community engagement and Preparedness
Any practical disaster risk reduction approach must include community involvement and preparedness. Pacific Island countries may ensure that local needs and views are considered and that communities have a greater capacity to respond to and recover from disasters by involving communities in designing, implementing, and monitoring DRR programs.
Creating community early warning systems and carrying out of regular disaster exercises are examples of community-based disaster preparedness initiatives. Additionally, community participation can increase the efficacy and support for DRR activities by fostering trust between citizens and authorities.
Case studies of successful disaster risk reduction initiatives
The successful implementation of various disaster risk reduction efforts in Pacific Island countries has shed light on practical methods for strengthening DRR in the area. The Pacific Catastrophe Risk Assessment and finance project (PCRAFI), which emerged in response to the expanding demand for disaster risk finance in the Pacific, is one such project.
Participating countries have access to catastrophe risk models, financial safety nets, and technical assistance for disaster risk management through PCRAFI. With the tools and resources it offers, the project has proven to be a highly successful means of assisting Pacific Island countries to identify and manage their disaster risk.
The Pacific Climate Change and Migration (PCCM) project, which intends to raise the resilience of vulnerable populations in Fiji and Tuvalu to the effects of climate change, including displacement and migration, is another effective program. The project has concentrated on a variety of interventions, such as the building of climate-resilient infrastructure, the promotion of community-based disaster risk reduction, and the development of sustainable methods for livelihood.
The PCCM project highlights the value of tackling the underlying factors that increase disaster risk, such as climate change and incorporating disaster risk reduction (DRR) into larger development projects. Pacific Island countries may create more resilient and sustainable populations by approaching disaster risk reduction strategically.
The Role of international cooperation in disaster risk reduction
Effective disaster risk reduction in the Pacific region requires global cooperation. International cooperation and support are crucial because many Pacific Island countries lack the resources and capacity to manage their disaster risk independently.
International cooperation can take many forms, including knowledge sharing, capacity building, and financial and technical support. For instance, the United Nations Development Programme (UNDP) has generously supported initiatives in the Pacific to reduce disaster risk, such as creating early warning systems, establishing community-based disaster preparedness programs, and promoting climate change adaptation.
Incorporating regional expertise and customs into DRR activities can be significantly aided by international cooperation. International partners can contribute to ensuring that DRR strategies are practical and culturally appropriate by collaborating closely with local communities and traditional leaders.
Incorporating local knowledge and traditional practices
Initiatives for reducing the risk of disaster must incorporate local expertise and customs to be effective and long-lasting. The inhabitants of the Pacific Islands have abundant knowledge and experience in dealing with natural disasters, and their customs and traditions can offer essential insights into efficient DRR techniques.
Many Pacific Island societies, for instance, have created complex early warning systems using their understanding of the environment and natural occurrences. Countries in the Pacific Islands can improve their capacity for disaster preparedness and response by integrating these systems into more comprehensive DRR policies.
Culturing climate-resilient crops and constructing cyclone-resistant homes are examples of traditional practices that can offer important insights into effective adaptation strategies. Pacific Islander countries may create more resilient and sustainable communities by recognizing and adopting these practices into DRR projects.
Building a Culture of Resilience in Pacific Island Communities
Effective disaster risk reduction in Pacific Island communities depends on fostering a culture of resilience. This entails implementing efficient DRR measures and giving communities the tools they need to manage their risk of disasters and increase their resilience.
Communities can be empowered to actively participate in disaster preparedness and response through community-based approaches to disaster risk reduction, such as those used in the PCCM project. These techniques can also assist in fostering trust and collaboration between communities and authorities.
Furthermore, building a culture of resilience in Pacific Island communities can be facilitated by raising awareness and educating people about disaster risk reduction. Pacific Island countries may create more resilient communities and lessen the potential effect of natural disasters by giving populations the expertise and skills they need to understand and handle their disaster risk.
Monitoring and evaluating disaster risk reduction progress
Monitoring and assessing their progress is crucial for disaster risk reduction strategies to be effective and persistent. Pacific Island countries can continuously hone and enhance their DRR strategies, enhancing their capacity for resilience over time by monitoring progress and identifying areas for improvement.
The development of data management systems, setting up surveys and evaluations, and establishing performance indicators are just a few examples of the various ways that monitoring and evaluation can be carried out. Pacific Island governments may ensure that their DRR projects are based on evidence and successful by investing in these tools and procedures.
Envisioning a Robust and Sustainable Future for Pacific Island Nations through Collaborative Endeavors and Holistic Strategies
It takes a variety of tactics and approaches to effectively increase disaster risk reduction in Pacific Island countries. Pacific Island countries may build a more robust future for all people by emphasizing infrastructure resilience, early warning systems, community participation and preparedness, and incorporating indigenous knowledge and traditional practices.
Effective disaster risk reduction in the Pacific requires global cooperation and encouraging a resilient culture. Pacific Island nations can lessen their susceptibility to natural disasters and promote sustainable development by cooperating and strengthening local populations.
Monitoring and evaluation will be crucial to ensuring that DRR projects in the area are successful and long-lasting. By continuously enhancing and upgrading our methods, we can create a more resilient and prosperous future for Pacific Island nations and their populations.


