Overviews
The overviews of Natural Disasters in China are the followings:
1) Death numbers
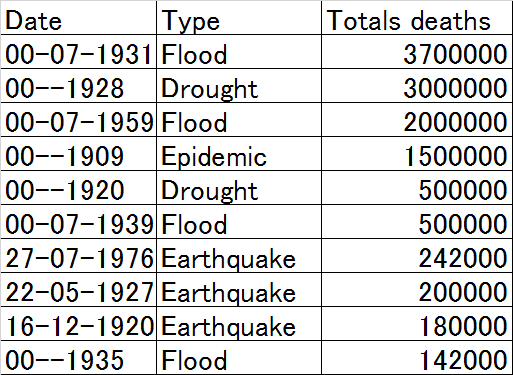
Source: EM-DAT
2) Affected numbers

Source: EM-DAT
3) Damage costs
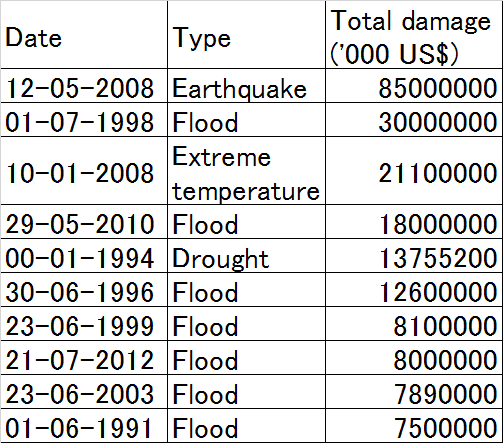
Source: EM-DAT
Natural disasters in China are very large scales, reflecting country’s population and geographical size. Also, we need to know that China has a rapidly growing economy. We can confirm the normal historical trends of natural disasters, from human sufferings to economic damages, which this note already mentioned (Day 77). For instance, the top 10 deadliest natural disasters in China are all before 1970s. On the contrary, the top 10 costliest natural disasters in China all occurred after 1990s.
Two Earthquakes
Yang Zhang William Drake et al. (2016)* indicate interesting views on two earthquake disaster recoveries: the 1976 Tangshan earthquake and the 2008 Wenchuan earthquake. The point is why the 2008 Wenchuan earthquake recovery was so rapid compared to the 1976 earthquake.
However, the paper could add the total background changes in China, such as the economy and politics. China has changed dramatically since 1976, from historical viewpoints.
A comparison of the two earthquakes will be explained.
Yang Zhang William Drake et al. (2016), Disaster Recovery Planning after Two Catastrophes: The 1976 Tangshan Earthquake and the 2008 Wenchuan Earthquake, International Journal of Mass Emergencies and Disasters, 34(2):174–200.