research methods」カテゴリーアーカイブ

Day_41: disaster vulnerabilities by regions

I just used 1980–2008 natural disaster data (ADRC 2009) and calculated the numbers of fatalities divided by the number of disasters to know the vulnerabilities. The regions mean Asia, the Americas, Africa, Europe, and Oceania.

The following is the order. Sorry, just order; however, we can learn something from the order.

The number of fatalities
1. Asia
2. Americas
3. Africa
4. Europe
5. Oceania

The number of fatalities divided by the numbers of disasters
1. Asia
2. Africa
3. Oceania
3. Americas
4. Europe

The above indicates the vulnerabilities of regions. For example, people in Africa tend to die easily by natural disasters; on the contrary, people in America tend not.

Day_36 : Disaster Scenario

A Disaster Scenario is one of the ways to raise our disaster management skills. This is a kind of role-playing or simulation. The science can be applied to make the scenario more real. The disaster scenarios can be applied from personal level to national one. We usually tend to have normalcy bias; however, well-planned disaster scenarios could break such bias.

* Normalcy bias (Wikipedia)
We tend not to want to accept abnormal situations.

Day_100 : A Human Suffering Exacerbation-Data from Greater New Orleans Community Data Center

The Greater New Orleans Community Data Center (GNOCDC) website was found after the field survey on Hurricane Katrina in Louisiana and Mississippi in 2005. I was so amazed. This is the one of the demographers great contributions to disaster research.

The site provides the information of the pre-Katrina situations by parish and also by ward. This is very useful to examine the social backgrounds of the areas in detail.

gnocdcPrekatrina
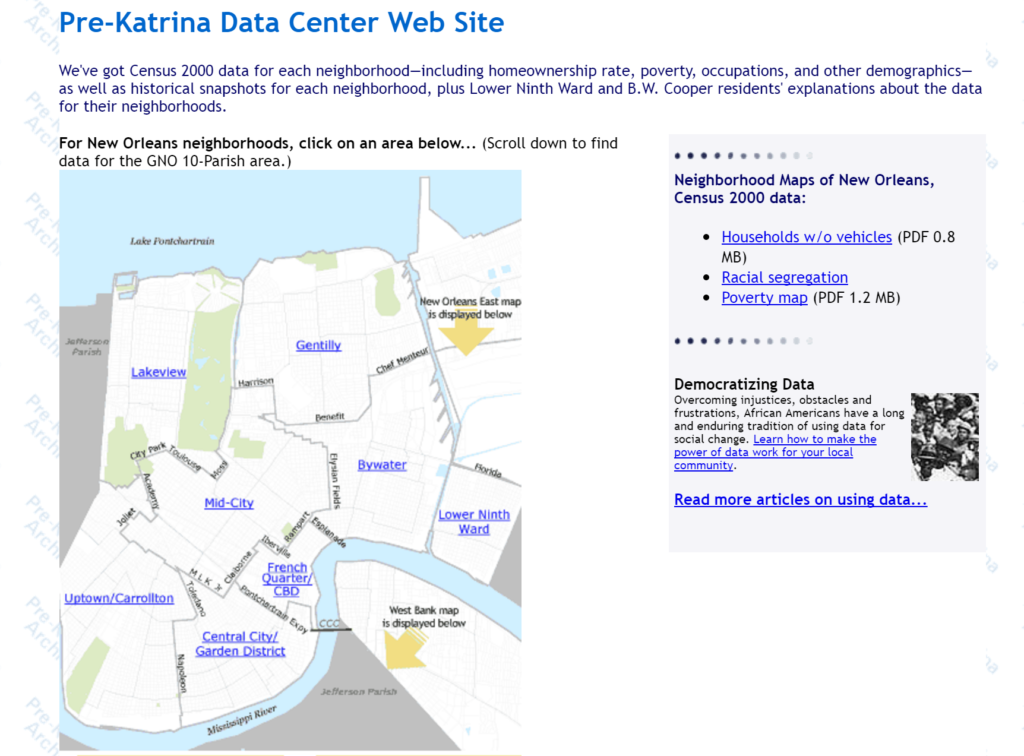
Figure 1 GNOCDC (Pre-Katrina data site)

The paper on Karina disaster using these data is to explain how human sufferings were exacerbated by the stage with the social background as shown in Figure 2 (Nakasu, 2006 :Sorry in Japanese, however, summary and figures are in English).

human suffering
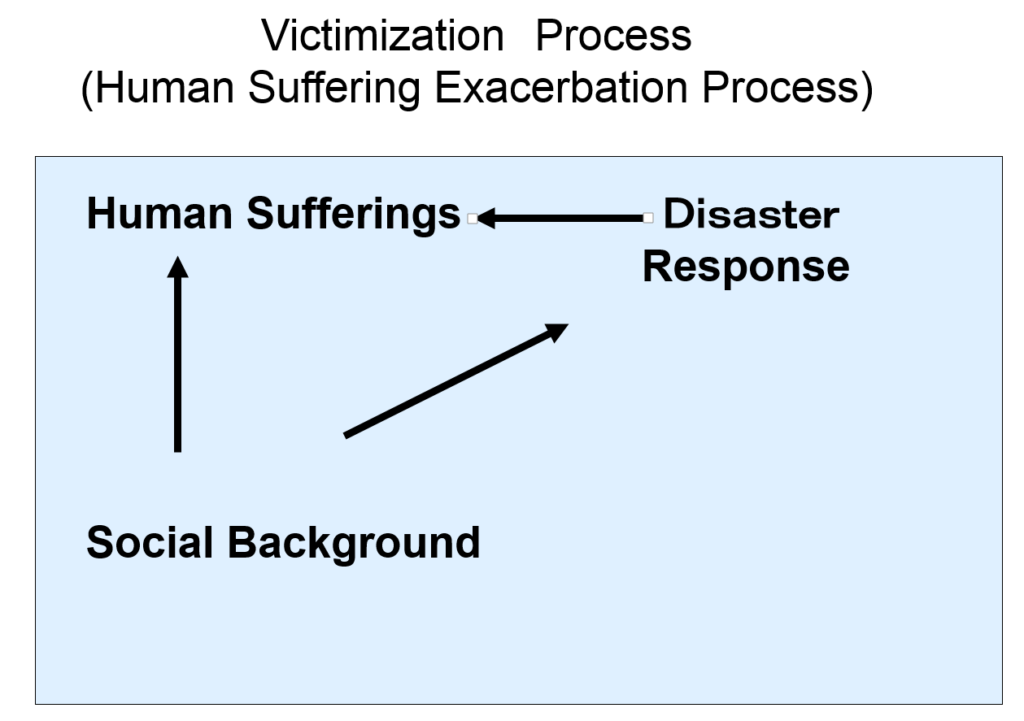
Figure 2 Victimization Process
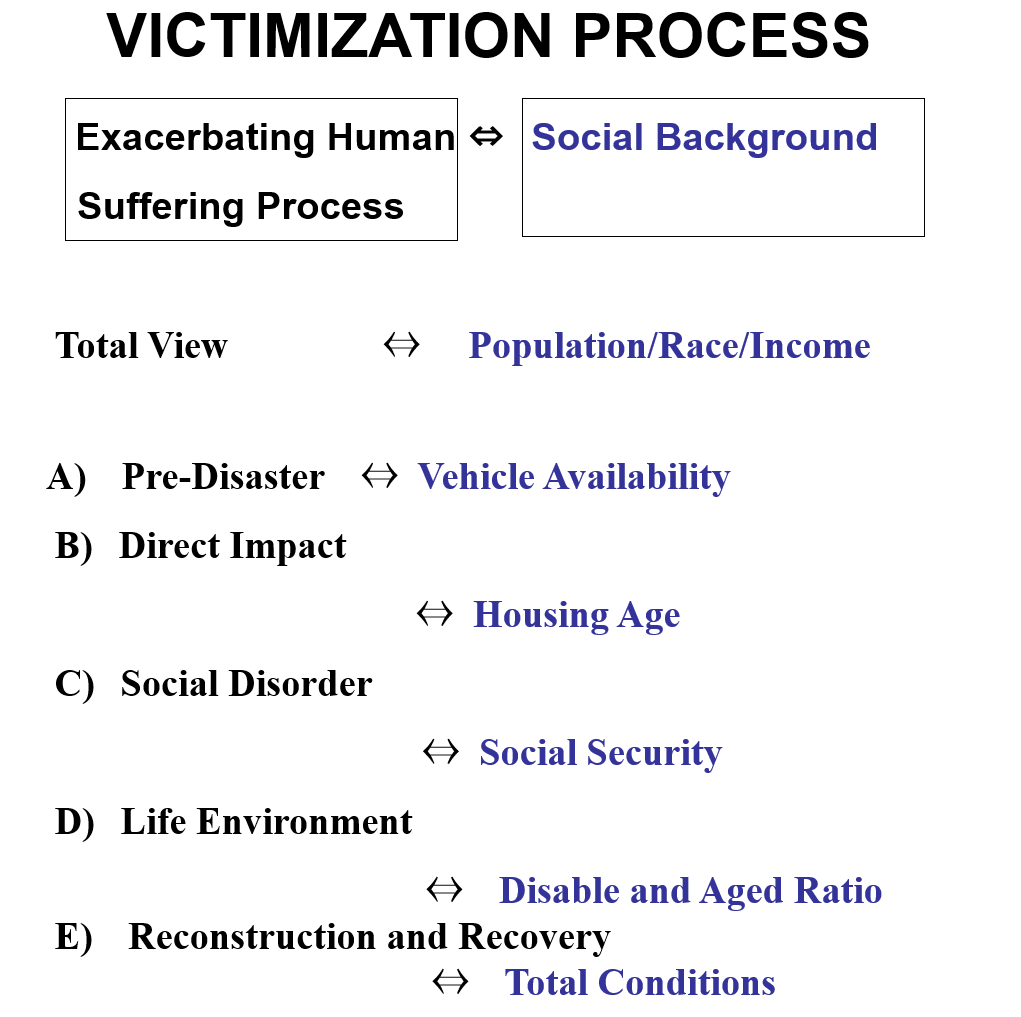
exacerbation2
Figure 3
Victimization Process by Stage

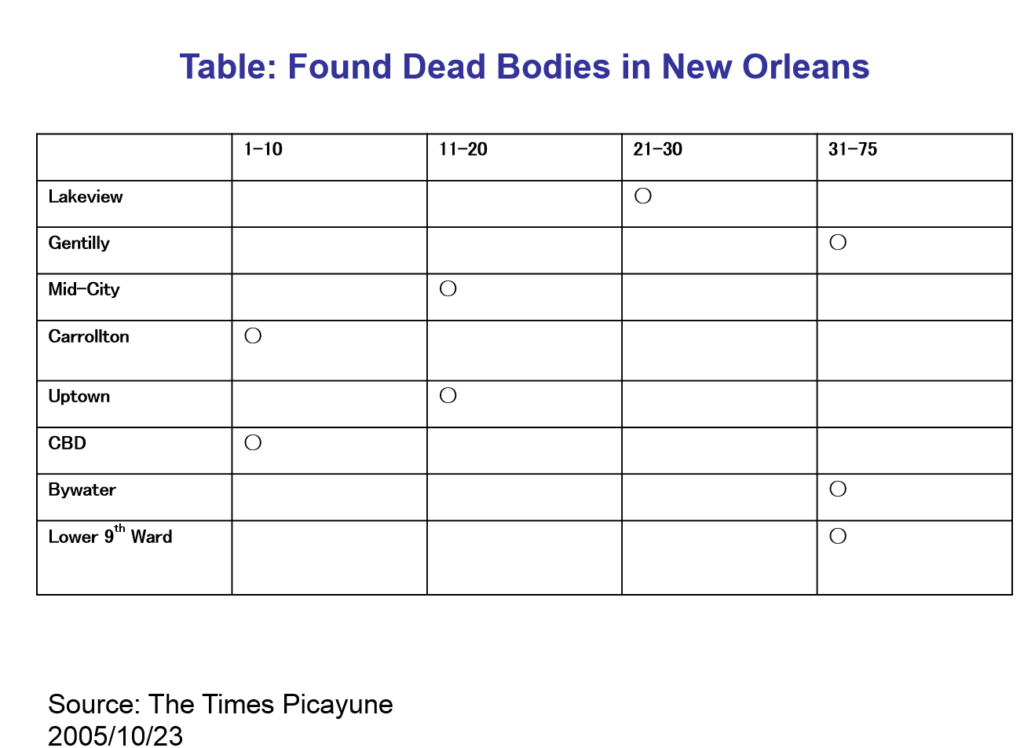
Table 1 Found Dead Bodies in New Orleans  

dead in neworleans

The process can be divided into five stages with time such as A) Pre-disaster B) Direct damage C) Social disorder D) Life environment  E) Reconstruction and recovery. Then, these are examined with the social background data (Figure 3).

For example,  1) Pre-disaster stage, I picked up an evacuation aspect to explain the social background of this stage.

Using the GNOCDC database, I could check the possession ratio of the vehicle in some areas.

novehicle
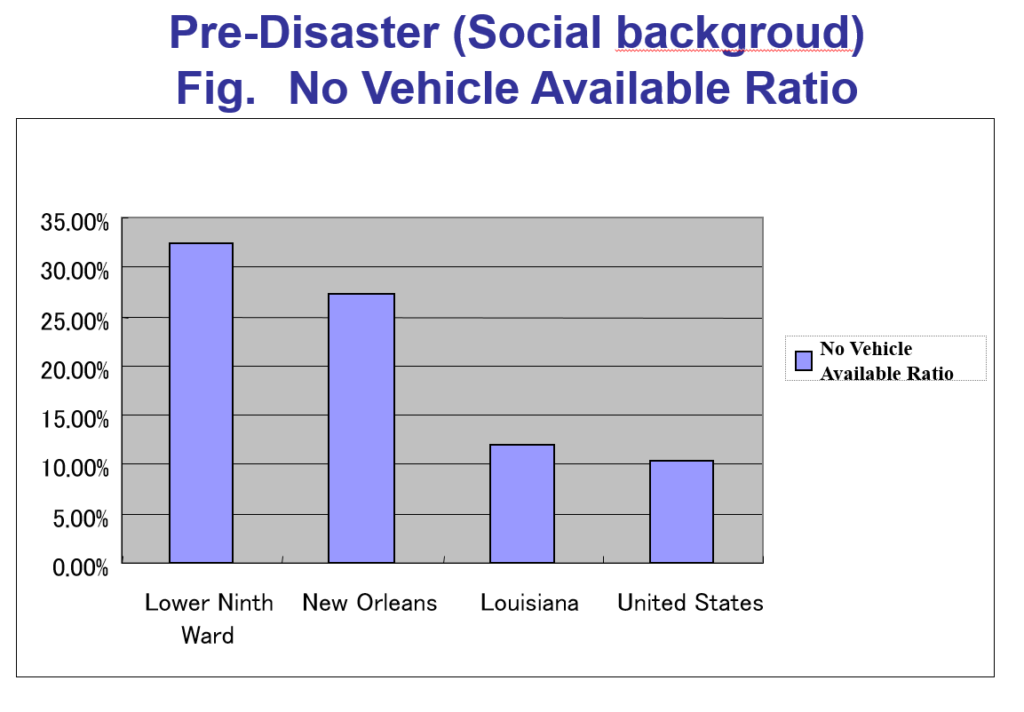
Figure 4 No Vehicle Available Ratio (GNOCDC)

Table 1 and Figure 4 show the people in Lower 9th ward, one of the most severely affected areas, had a low possession ratio of the vehicle. This can explain so many residents needed to have government help to evacuate and they could not evacuate before the Hurricane hit.

The general social background, such as ethnic groups, household incomes, and others with other stages of examinations will be discussed later.


The Great Deluge: Hurricane Katrina, New Orleans, and the Mississippi Gulf Coast (English Edition)

Day_93: Natural disasters in Thailand – National Disaster Risk Assessement Mapping

Day_18 mentioned “More must be done to fight climate change” (Bangkok Post)

https://disasterresearchnotes.site/archives/2304

The national risk assessment mapping in Thailand is briefly explained below.

Table 1  Disaster data in Thailand
em-dat_thailand
A target period of these EM-DAT data is from 1900 to 2014. However, the large numbers of death, affected people, and damage cost caused by natural disasters are all after 1970s as shown in Table 1. The data clarify the 2004 Indian Ocean Tsunami and the 2011 Chao Phraya river flood disasters are so influential in Thailand.

riskmapping_thailand
Figure 1 National Risk Assessment Mapping in Thailand

Using EM-DAT data of Thailand (1900-2014), Figure 1 was created. These risk assessment mapping (Frequency-Impact by each damage type) is very simple, but we can easily grasp the whole pictures of the risks.

To evaluate each risk, the following risk matrix options are useful.
riskoption1
Figure 2 Risk matrix options (1)

riskoption2
Figure 3 Risk matrix options (2)

It is clear that the flood is the most countermeasures required disaster in Thailand from the Figure1. By using Figure 2 and 3, for example, we can recognize the extensive management and monitoring are essential and immediate action must be taken against the floods.

The above explanations are very rough. Detailed explanations will be discussed later.

The above was already published with explanations as a report for the Japanese Association for Earthquake and Engineering (JAEE).

Day_90 : (Re)Evacuation research literature analysis-A Text mining

Evacuation’s research literatures are divided into two categories for this analysis. One is natural disaster’s research literature conducted by all specialties. The other is social scientist’s research literature on natural disasters. The database, the Springer link, is selected to conduct all field’s evacuation research literature analysis. The E. L.Quarantelli Resource Collection (See the Website), Disaster Research Center of the University of Delaware was chosen as a target database for analyzing social science literature. The collection is one of the world’s most complete ones on the social and behavioral science aspects of disasters. These two databases’ literatures were analyzed by a text mining. To conduct the text mining, the RH Corder was used.

The following is just one result example, a content analysis of the springer link database.

  1. Search words are “evacuation AND urban AND (tsunami OR flood OR typhoon OR hurricane)”
  2. The number of extracted literature is 824 (2000-2014)
  3. The titles, key words, and abstracts of the 824 were combined into one text file
  4. The extracted words which appear over 20 times in the text are shown in Table1
  5. A co-occurrence network analysis result is indicated in Figure 1

Table 1       Extracted Words (over 20 times) and Frequencies (sorry, original Japanese version’s words are left)

wordsfreq

140715_村上先生_共起ネットワーク2

Figure 1 A co-occurrence network analysis result

In Figure1, the circle sizes around the words (Nodes sizes) mean the frequencies of the words appeared in the text. Edges mean the connections between the words. Then, you can see the above analysis (by color) result.

For instance, emergency response-preparedness-decision-support with “event” are combined with evacuation as key words. Climate-change-impact was also detected with coastal-adaptation. We can estimate that detected Taiwan-assess-community-resilience represents the Typhoon Morakot disaster. (Then, this is confirmed by returning to the original text.)

Murakami et al. (Murakami, Nakasu, Shimamura, Goto, and Ogawa, 2015) is referred.

Day_63: Snowstorm Disaster

There were 9 casualties caused by heavy snowstorms in Hokkaido on 2-3 March 2013.
In Yubetsu town, a father (58) was found dead. But his daughter (9) was survived. The father had been holding his daughter in his arms to protect her from coldness.
In Nakashibetsu town , 4 were dead. They died in a car because they stopped the car and could not go out because of the conditions. They tried to call acquaintances for help again and again. However, they could not get helps during the time.

The Snow and Ice Research Center, NIED (National Research Institute for Earth Science and Disaster Prevention) has launched the project to prevent snow storm disasters after the disaster in Nakashibetsu. The project has focused on the snow storm predicting system not only for officers, but also for local people. It is difficult to predict the storm because the snow storm happens with complex conditions, at snow drift and storm. Needed to check not only weather, but also land conditions.

The example of the use, the school children stopped to go back to home because the snow storm was predicted on their way home

We can see the placed live web cam.
Monitoring video can be accessed by the following sites.
http://yukibousai.bosai.go.jp/nakashibetsu_open/webcam/web_cam_nasbt1.htm
http://yukibousai.bosai.go.jp/nakashibetsu_open/webcam/nakasibetu_test.htm

[ad#ads1]

Day_56 : A cyclic model of development-environment-disaster

I once proposed a model for analyzing relationships between natural disasters and society, a cyclic model of development-environment-disaster. This provides a long-term perspective and an overhead view for examining natural disasters. This analytical framework could expand on previous research from the viewpoints of the nexus between development and environment and also development and disasters. This also makes it possible to consider the relationships between development, environment, and disasters and the process from the disaster to the victims and from the disaster back to development.

160731_cyclic model

Not only that, but this circular thinking method also provides viewpoints of circulation, opposite direction, cycle speed, time, development stage, and so on. Moreover, this framework provides foresight into considering relationships, not only for development, environment, and disasters in terms of domestic views but also for two or more countries. This is effective for grasping the meaning of natural disasters in the social context. In other words, this framework makes it possible to stimulate sociological imagination and to visualize the issues.

I actually analyzed the Typhoon Iwean disaster in 1959, the Indian Ocean Tsunami disaster in 2004, and the Great East Japan Earthquake and Tsunami disaster in 2011 with this framework. However, these works are only in Japanese.

To be continued.

Abstract of the Japanese paper
http://ci.nii.ac.jp/naid/110008664615/en

Day_52 : The PDNA (Fiji, cycloone winston ) was issued

The Post Disaster Needs Assessment with regard to cyclone winston disaster in Fiji was issued.

TC Winston’s passage from Fiji, reports emerged of widespread damage and destruction, with the cyclone impacting approximately 540,400 people, equivalent to 62 percent of the country’s total population.
The storm brought down the power and communications systems linking the islands, with approximately 80 percent of the nation’s population, losing power, including the entire island of Vanua Levu, and 44 fatalities were subsequently confir1med. Entire communities were destroyed and approximately 40,000 people required immediate assistance following the cyclone.30,369 houses,495 schools and 88 health clinics and medical facilities were damaged or destroyed. In addition, the cyclone destroyed
crops on a large scale and compromised the livelihoods of almost 60 percent of Fiji’s population.

Source:
https://www.gfdrr.org/sites/default/files/publication/Post%20Disaster%20Needs%20Assessments%20CYCLONE%20WINSTON%20Fiji%202016%20(Online%20Version).pdf

Other related info.

Relief web
http://reliefweb.int/disaster/tc-2016-000014-fji

The below link, Economic Commission for Latin America and Caribbean (ECLAC) disaster assessment handbook, is really really core of the disaster assessment field.

http://www.cepal.org/en/publications/handbook-disaster-assessment

Day_42: 人口と災害【3】:人口研究とアジア[Japanese]

災害に関する人口研究の重要性

William Donner and Havidan Rodriguez(2008)は、気候変動より、人口変動による将来の自然災害によるリスクの重要性を指摘している。現実問題として、将来の気候変動による災害に対する影響などは、IPCCなどの主導による研究に代表されるように多くの研究成果が主に自然科学者などにより実施されているが、人口の変動による将来の災害に対する影響の研究は、指標研究を含めてほとんど語られていないのが現状であり、課題となっている。

アジア地域の脆弱性

Munich Re(ミュンヘン再保険会社)によるデータによれば、1980年から2014年における、アジア、アフリカ、北・中央アメリカ、南アメリカ、オーストラリア/オセアニアに分類した世界全体の地域別自然災害のうち、アジアの占める割り合いは、死者数で、69%、経済損失で40%に及び、最も脆弱な地域であることを示している。また同時にアジアは、沿岸部への人口の集中とともに、高齢化が特に進んでいる地域でもある(大泉 2007)。これらは、アジアにおける自然災害に対する脆弱性は今後ますます高まると言っても過言ではない。将来気候変動が叫ばれるなか、さらに日本では、南海トラフや首都直下地震、さらには、2016年の熊本地震で示されるように、いつどこで起こってもおかしくない地震をはじめ、ハザードの側面、及び、進む少子高齢化など社会的脆弱性の側面、両面からリスクは増加する傾向にあるといってよい。それらのリスクへの対応としては、ハザードすなわち自然現象に対するアプローチは主に工学や自然科学分野で多くなされているが、社会的脆弱性という意味での少子・高齢化などによるリスクへの影響に関する研究は、今後の災害対策を考えるうえでも益々重要な位置づけとなるだろう。

Day_29 : Human Vulnerability Index

I am developing the Human Vulnerability Index.

If you have some ideas about this issue, please let me know.

The HVI was originally developed when I was doing research on the Great East Japan Earthquake and Tsunami (GEJET) disaster in 2011. I needed to compare the disaster impact by municipality for not only the 2011 tsunami but also the 1896, 1933, and 1960 tsunamis. However, it was difficult to compare because geographical and population sizes are different by municipality. So the HVI was developed. A member of JAEE thankfully recognized this for the applications.

The following are just some parts; I will disclose the details in the paper and post the link here in the near future.

1. The HVI can be applied to compare the municipalities not only for the GEJET disaster but also with the historical tsunami events and clarify the historical trends.

2. The recurrent HVI was calculated by a ridge regression analysis using the evacuation-related factors, which this paper estimated based on some theories, such as the PAR model.

3. The HVI was also applied to two international cases: the 2004 Indian Ocean Tsunami and the 2005 Hurricane Katrina.

The HVI-related paper was published with Dr.Yozo Goto.
https://www.researchgate.net/publication/329961277_HUMAN_VULNERABILITY_INDEX_FOR_EVALUATING_TSUNAMI_EVACUATION_CAPABILITY_OF_COMMUNITIES_Eng_Version