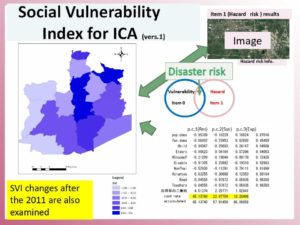
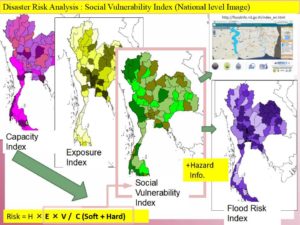
As discussed on Day 147, now we are investing the social vulnerability index of the district, sub-district, and village levels in Ayutthaya. To calculate the social vulnerability index, exposure, susceptibility, and capacity data are examined. Notably, the district level of the index is figured out, as shown in Figure 1, using principal component analysis.
(Please enlarge the screen to see the figure well. Darker blue means more vulnerable. The detailed factors of PCA will be explained later. )
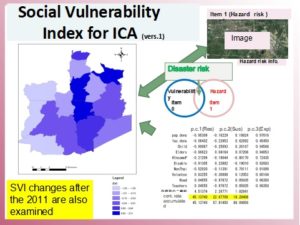
Figure 1: Social Vulnerability Index Industrial Complex Area(SVI-ICA) Ref. 1)
https://disasterresearchnotes.site/archives/3746
As mentioned above, the district level of the social vulnerability index can be figured out by statistical data. However, sub-district and village levels data are challenging to collect. We also need to understand the capacity is a factor that includes not only hard but also soft countermeasures against natural disasters, as discussed before. Especially, capacity-soft is not stable by time with circumstances and could be changing from time to time. The stats data is not enough to indicate their actual capacities.
Based on the above fact, the capacity assessment is considered to fill the gaps. The capacity assessment method was based on the FDPI project experience.
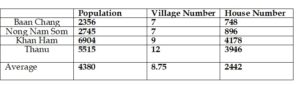
The population of the target areas is indicated below:
Table 1: The Population of the Tambons (Source: registration office 2019)
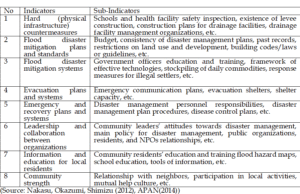
Below is the category (indicators) to measure the capacity.
Table 2: Indicators and Sub-Indicators for Capacity Assessment
The results are as indicated in Figure 2.
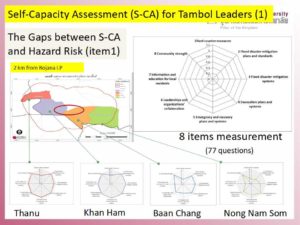
Figure 2: Four Sub-District Capacity Assessment
The findings show the western side and eastern side have a big gap, as you can see in Figure 2.
Figure 3 explains the education and training part is much different among the four target sub-district. The results mean we can monitor and evaluate their progress after we provide education, training, system, or so on there.
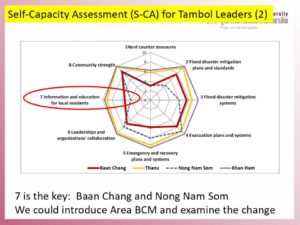
Figure 3: Capacity Assessment Analyses
For example, each sub-indicators are examined as follows:
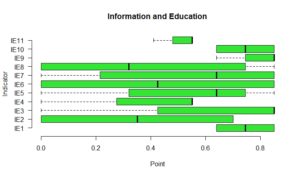
Figure 4: Information and Education Sub-Indicators Gaps
The analyses (the detailed sub-indicators from IE1 to IE11) will be explained later.
Related Book and Info.

At Risk: Natural Hazards, People’s Vulnerability and Disasters
*This is the baseline research for the SATREPS project.