Definitions」カテゴリーアーカイブ

Day_83 : Tsunami – the words

80% ofall tsunamis occurring in the world are concentrated in the Circum-Pacific Belt.The leading countries researching the tsunami are Japan, the U.S., and Russia. The tsunami is originally a Japanese term that means a high tidal wave. The name was used by Japanese immigrants during a tidal wave caused by the 1946 Aleutian Islands earthquake (tsunami) hit in Hiro, Hawaii and it became an international word, especially an academic word, ”Tsunami”. The International Union of Geodesy and Geophysics (IUGG) is in charge of a tsunami session at the start of an international conference about tsunamis. “Tsunami” became public after the 2004 Indian Ocean Tsunami disaster.

*The word “tsunami” is composed of the Japanese words “Tsu” (which means harbor) and “Nami” (which means “wave”)(ITIC)

The 1946 Aleutian Islands earthquake
Hiro, 1964

***Pacific Tsunami Museum in Hiro

Day_34 : The meanings of the Typhoon Makurazaki in 1945

After the second world war, Japan was vulnerable, so we had a lot of natural disasters, especially Typhoon disasters from 1945 to 1959. Some call this 15 years a great flood and storm era. The first hit was Typhoon Makurazaki on September 15, 1945*.The typhoon hit Hiroshima city. There were 1229 casualties in the city. This fact reminds us what happened in Hiroshima in the same year. The atomic bomb hit Hiroshima city this August. During the war, we had no weather forecast system because of military’s reasons. The people in Hiroshima were living in vulnerable houses because they were hardly hit by the bomb. They did not have enough information . about the typhoon’s coming, either. Therefore, this typhoon disaster is a complex disaster that consists of natural disasters, technological disasters, and human-made disasters.

*Hiroshima Pref. Website:
http://www.bousai.pref.hiroshima.jp.e.bq.hp.transer.com/www/contents/1318849427179/index.html
http://www.pref.hiroshima.lg.jp.e.bq.hp.transer.com/soshiki/100/makurazaki.html

**A Blank in the Weather Map by Kunio Yanagida

https://en.wikipedia.org/wiki/A_Blank_in_the_Weather_Map


Day_89 : Disaster Recovery Theory (1)

First, the theoretical examination’s concept is explained and two disaster recovery theories are introduced. Second, the first theory is explained and studied. Third, the second theory is explained and examined.

The concept is explained as follows:

The concept

Figure1 1: Disaster Recovery Concept

The following are the two disaster recovery theories used for this study.
Theoretical framework 1
Disasters contribute to change, they do so primarily by accelerating trends that are already underway prior to impact (Bates et al., 1963; Bates, 1982; Bates and Peacock, 1993; Haas et al., 1977).

2) Theoretical framework 2
The disaster Process is influenced by
① Devoted aid volume from outside society
② Disaster scale
Community Strength (Social System Strength) (Hirose, 1982)

The first theory is confirmed by some cases. You can see the following figures: the Kanto earthquake, Fukui earthquake, Typhoon Isewan in Japan, and Hurricane Katrina in US.
mizutanisensei_recovery
Figure 2: Disaster Recoveries in Japan

recovery_katrina
Figure 3: The Disaster Recovery from Hurricane Katrina in US.

To be continued…

This is  the presentation summary. The presentation was made in 2011, after the tsunami in Japan.

Day_187: Disaster Definitions


Day_23 : The Definitions


Disasters are indeed categorized based on their origin and the factors that contribute to their occurrence. This categorization into natural, technological, and human-made disasters is critical for understanding the varying dynamics of disaster risk, management, and mitigation strategies. Here’s a brief overview of each category, along with references that provide in-depth insights:

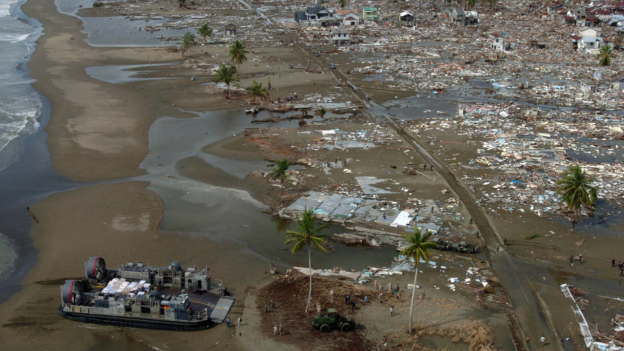
1. Natural disasters: These include earthquakes, hurricanes, floods, wildfires, and volcanic eruptions as examples of natural processes and phenomena. Even though human activity can exacerbate their effects, natural disasters are frequently beyond human control.

Reference: Cutter, S. L. (2005). The Geography of Social Vulnerability: Race, Class, and Catastrophe. Social Science Quarterly, 84(2), 242-261. This work explores the social dimensions of vulnerability to natural disasters, highlighting the intersection of social factors with natural phenomena.

2. Technological Disasters: Also known as anthropogenic or man-made disasters, these occur as a result of technological or industrial accidents, infrastructure failures, or specific human activities that lead to catastrophic events. Examples include chemical spills, nuclear accidents, and industrial explosions.

Reference: Perrow, C. (1984). Normal Accidents: Living with High-Risk Technologies. Princeton University Press. Perrow analyzes the inherent risks of complex technological systems and the inevitability of failures that lead to disasters.

3. Human-Made Disasters: This category includes events that are a direct result of human actions but are not necessarily related to technological failures. These can include acts of terrorism, armed conflicts, and widespread violence. Human-made disasters are characterized by their intentional nature and the purposeful infliction of harm on communities or the environment.

Reference: Wisner, B., Blaikie, P., Cannon, T., & Davis, I. (2004). *At Risk: Natural Hazards, People’s Vulnerability, and Disasters*. Routledge. Although primarily focused on natural hazards, this book provides a comprehensive framework for understanding vulnerability and resilience in the context of various disaster types, including human-made events.

Each of these categories underscores the need for tailored approaches to disaster risk reduction, preparedness, response, and recovery. Understanding the specific characteristics, causes, and impacts of each type of disaster is crucial for developing effective management and mitigation strategies.

Day_165: Capacity, Coping Capacity, and Capacity Assessment

Based on the UNDRR, capacity, coping capacity, and capacity assessment are defined as follows:

Capacity is “the combination of all the strengths, attributes and resources available within an organization, community or society to manage and reduce disaster risks and strengthen resilience.” and also annotated, “capacity may include infrastructure, institutions, human knowledge and skills, and collective attributes such as social relationships, leadership and management”

Coping capacity is “the ability of people, organizations and systems, using available skills and resources, to manage adverse conditions, risk or disasters. The capacity to cope requires continuing awareness, resources and good management, both in normal times as well as during disasters or adverse conditions. Coping capacities contribute to the reduction of disaster risks.”

Capacity assessment is “the process by which the capacity of a group, organization or society is reviewed against desired goals, where existing capacities are identified for maintenance or strengthening and capacity gaps are identified for further action.”

We consider the capacity as a part of the vulnerability mentioned in the Press and Release (PAR) model. The capacity is examined as a coping capacity in the context of the disaster.

This means capacity is more changing, human-centered, government-related, and has timely measurement aspects compared to the other vulnerability factors.

As mentioned above, capacity is considered one of the vulnerability factors, and the vulnerability index can be analyzed based on the statistical data. However, the applicable capacity statistical data is difficult to determine and also difficult to obtain in Thailand. In addition, capacity cannot be measured well by the statistical data. They could be greatly influenced by social networks, past experience, and other factors. With this situation, the capacity assessment can be utilized not only to measure social vulnerability but also to visualize the risk by overlapping with hazard risk on the GIS. Also, capacity can be considered to be the key to examining resilience.

Day_34 (rev): The meanings of the Typhoon Makurazaki in 1945

After the second world war, Japan was vulnerable, so we had a lot of natural disasters, especially Typhoon disasters from 1945 to 1959. Some call this 15 years a great flood and storm era(see the below figure). The first hit was Typhoon Makurazaki in Sep. 1945*.The typhoon disrupted Hiroshima city. There were 1229 casualties in the city. This fact reminds us of what happened in Hiroshima in the same year. The atomic bomb destroyed Hiroshima city on August, one month before the typhoon. During the war, we had no weather forecast system because of the military’s reasons. The people in Hiroshima were living in vulnerable houses because they were hardly hit by the bomb. They did not have enough info. about the Typhoon’s coming also**. Therefore, this typhoon disaster is a complex disaster which consists of natural disasters and human-made disasters aspects***.

deathtollafterww2

Figure: The Number of Deaths and Missing Persons Caused by Natural Disasters

*Hiroshima Pref. Website:
http://www.bousai.pref.hiroshima.jp.e.bq.hp.transer.com/www/contents/1318849427179/index.html
http://www.pref.hiroshima.lg.jp.e.bq.hp.transer.com/soshiki/100/makurazaki.html

**A Blank in the Weather Map by Kunio Yanagida:
https://en.wikipedia.org/wiki/A_Blank_in_the_Weather_Map

Kunio Yanagita was a Japanese scholar who is often known as the father of Japanese native folkloristics or minzokugaku.

***Day_23: The Definitions
https://disasterresearchnotes.site/archives/2355

Day_84 : Northridge and Kobe

Below is just a comparison between 1994 Northridge and 1995 Kobe earthquakes.

Time
Northridge: :January 17, at 4:30:55 a.m. PST, in 1994 (Mw6.7)
Kobe: January 17, at 05:46:53 JST in 1995 (Mw6.9)

Death toll
Northridge: 57
Kobe: 6,434

Cost
Northridge: Property damage was estimated to be between $13 and $40 billion
Kobe: Around ten trillion yen ($100 billion) in damage, 2.5% of Japan’s GDP at the time.

Both earthquakes are in the costliest disasters (Overall losses) in the world (1980–2004), as you can see in the below figure(Munich Re).

costliesdisasters

However, we need to notice the death toll’s huge gap between the two, even if they happened almost at the same time on the same day with almost the same magnitudes. This tells us natural disaster is not “natural”. The earthquake itself does not kill people; it is just a natural phenomenon. We create “natural” disasters.

Day_72 : 1983 Sea of Japan earthquake

The 1983 Sea of Japan earthquake or 1983 Nihonkai-Chubu earthquake occurred on May 26.The magnitude of the earthquake was 7.8.It occurred in the Sea of Japan. The mortality number was 104 and 100 were caused by the tsunami. The tsunami hit communities along the coast, especially, Aomori and Akita Prefectures and the east coast of Noto Peninsula.
There are three things to share about the tsunami disaster.
The first is the tsunami generated location, the second is the broadcasting, and the third is the victims of school children. The first, there was an ancient tradition which tsunami never hit the coast of the sea of Japan. This normalcy bias* exacerbates the damage. The second, this was the first tsunami disaster  broadcasted all over the world during the time. The people who had homevideo also contributed to the media. The tsunami warning system, wireless tsunami information from the sea of Japan to the local area, to inform local people was improved after the event. The third, 43 school children were hit and 13 were passed away. They were on an excursion. The school teacher could not do anything during the time. The 2011 Great East Japan Earthquake and Tsunami disaster also had some teachers related issues. The both tsunamis were daytime tsunamis.

*Normalcy bias

http://disasters.weblike.jp/disasters/archives/2607

Day_67 : Disaster Terminology

The disaster terminology is very important to have a common picture to discuss among the related people. The UNISDR provides a very useful website to confirm the term. For example, the adaptation is defined as “The adjustment in natural or human systems in response to actual or expected climatic stimuli or their effects, which moderates harm or exploits beneficial opportunities”. The following is the website.

https://www.unisdr.org/we/inform/terminology

Day_66 : Disaster Books At Riks, Measuring Vulnerability, and Disaster Theory (2)

The following books are very useful to understand disasters.
1. At Risk: Natural Hazards, People’s Vulnerability, and Disasters
2. Measuring Vulnerability to Natural Hazards: Towards Disaster Resilient Societies
3. Disaster Theory

1. “At risk” was already mentioned.


At Risk: Natural Hazards, People’s Vulnerability and Disasters

2. Birkman’s Measuring Vulnerability to Natural Hazards. This book is really really useful to understand the vulnerability of disaster research perspectives. The first, we can recognize what the vulnerability is. The second, this clarifies the vulnerability based on the people living in the areas. So the book divided the chapters or sections by the national, local, and community level. A brief explanation is found in the UN websites. An attached url also can be referred. This helps us to understand the Index, indices, and Indicators related work, which is internationally renown.


Measuring Vulnerability to Natural Hazards: Towards Disaster Resilient Societies

However, I also notice the vulnerability is one of the western thinking words facilitated by UN or developed countries. These kinds of “popular words” sometimes stop us to think the true meanings and the question of why this becomes popular. To avoid this, we can read these kinds of books from various perspectives.

3.Disaster Theory is very important to grasp the whole picture of what is the disasters and related terminologies. This book taught me a lot.


Disaster Theory: An Interdisciplinary Approach to Concepts and Causes (English Edition)