Kobe」タグアーカイブ

Day_76 : 1995 Kobe Earthquake victims

The 1995 Kobe earthquake taught us a lot of lessons. Today I am going to give you the following two questions:.
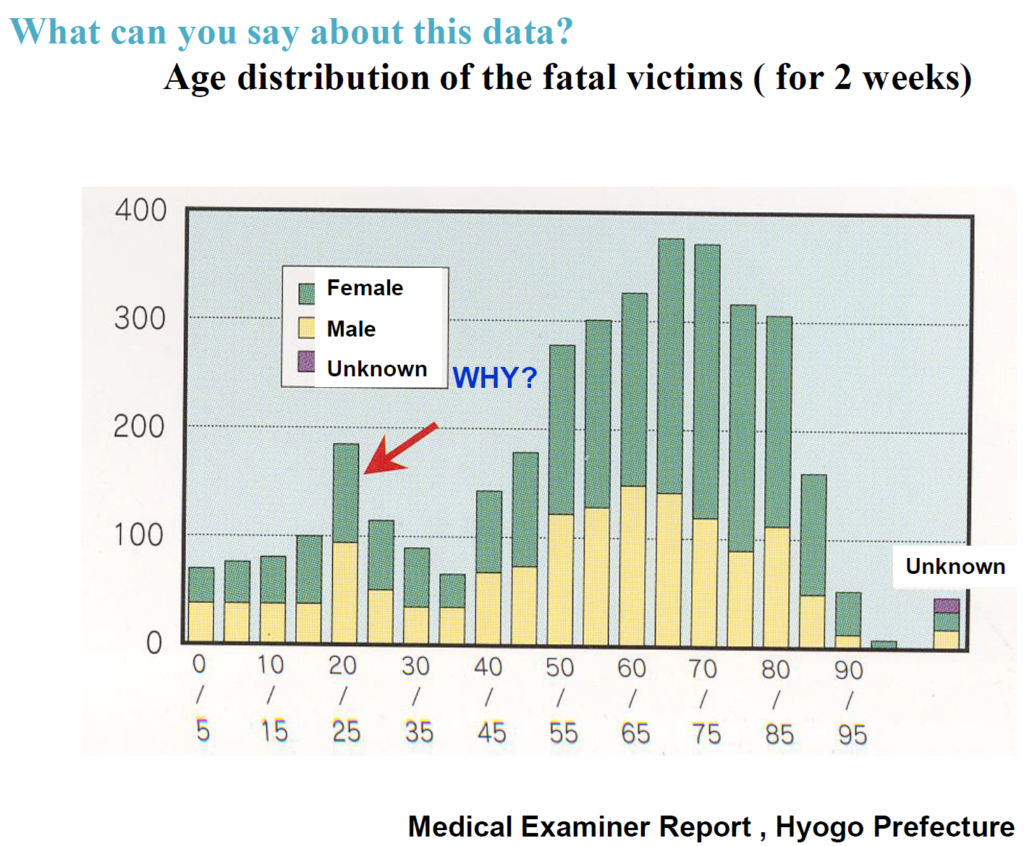
1) Why were there so many early 20s victims?
2) Which floor is more dangerous, 1st or 2nd?

1) Please look at the following picture. You can see the victims’ age distribution. Females and elderlies are more likely to be victimized because of their lack of physical strength. However, why did so many people in their early 20s die? Yes, they were university students. There are many universities in Kobe. Students tended to be less rich. They tended to stay on the 1st floor in cheaper wooden apartments.

kobe victims age distributions

2) You already know the answer. Of course, the first floor is more dangerous, especially in a wooden house. 1981 is the year in which the Japanese government set the building code. So the buildings, apartments, etc. built after the year tended not to be destroyed by the earthquake, including the Kobe earthquake.

1stfloorKobe

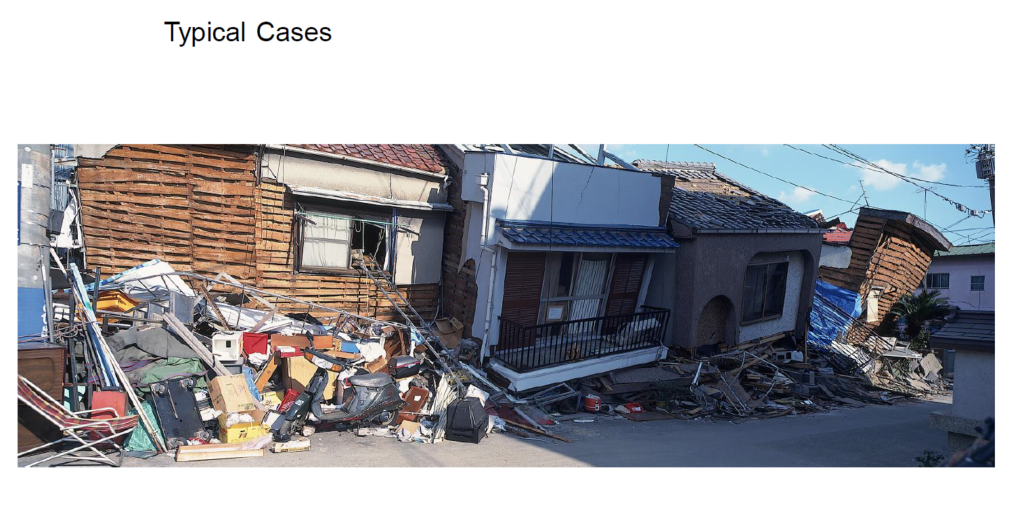
Photo: Dr.Takashi Inokuchi

We should learn the lessons from the disaster; this is the best thing we can do for the victims.


Day_58: Asian Disaster Reduction Center (ADRC) and Kobe Earthquake

ADRC is established in 1998 after the Kobe Earthquake. Kobe city’s population had caught up the same level before the disaster in 9 years. Kobe reinvents itself as a center of disaster reduction policies and activities in the world. There are so many disaster-related organizations in HAT Kobe. The HAT means “Happy and Active” and also “surprised” in Japanese. This is a good example to refer to for the disaster recovery process. We can learn the lessons from Kobe. ADRC contributes to disaster reduction policies and activities for member countries in Asia. We can check member countries disaster management systems, country reports, and others. We can also confirm the updated disasters on the ADRC’s website.

*ADRC member countries information site.

http://www.adrc.asia/disaster/index.php

** Disaster Information
http://www.adrc.asia/latest/index.php

Day_123 : 1995 Kobe Earthquake victims (2)- Golden 72 hours

Day_76 gave you the following two inquiries on the 1995 Kobe earthquake:.
1) Why were so many early 20’s victims victimized?
2) Which floor is more dangerous, 1st or 2nd?

Day_76 : 1995 Kobe Earthquake victims


The next question is: what can you say about the following Figure 1?

rescue
Figure 1: Search & Rescue Operation Statistics

You can see the survival rate dramatically dropped after 3 days and 72 hours. The experts say this 72 hours after the disaster, especially earthquake, is golden 72 hours. This is a well-known phrase even before the Kobe earthquake.

Day_84 : Northridge and Kobe

Below is just a comparison between 1994 Northridge and 1995 Kobe earthquakes.

Time
Northridge: :January 17, at 4:30:55 a.m. PST, in 1994 (Mw6.7)
Kobe: January 17, at 05:46:53 JST in 1995 (Mw6.9)

Death toll
Northridge: 57
Kobe: 6,434

Cost
Northridge: Property damage was estimated to be between $13 and $40 billion
Kobe: Around ten trillion yen ($100 billion) in damage, 2.5% of Japan’s GDP at the time.

Both earthquakes are in the costliest disasters (Overall losses) in the world (1980–2004), as you can see in the below figure(Munich Re).

costliesdisasters

However, we need to notice the death toll’s huge gap between the two, even if they happened almost at the same time on the same day with almost the same magnitudes. This tells us natural disaster is not “natural”. The earthquake itself does not kill people; it is just a natural phenomenon. We create “natural” disasters.