First, the theoretical examination’s concept is explained and two disaster recovery theories are introduced. Second, the first theory is explained and studied. Third, the second theory is explained and examined.
The following are the two disaster recovery theories used for this study.
Theoretical framework 1
Disasters contribute to change, they do so primarily by accelerating trends that are already underway prior to impact (Bates et al., 1963; Bates, 1982; Bates and Peacock, 1993; Haas et al., 1977).
2) Theoretical framework 2
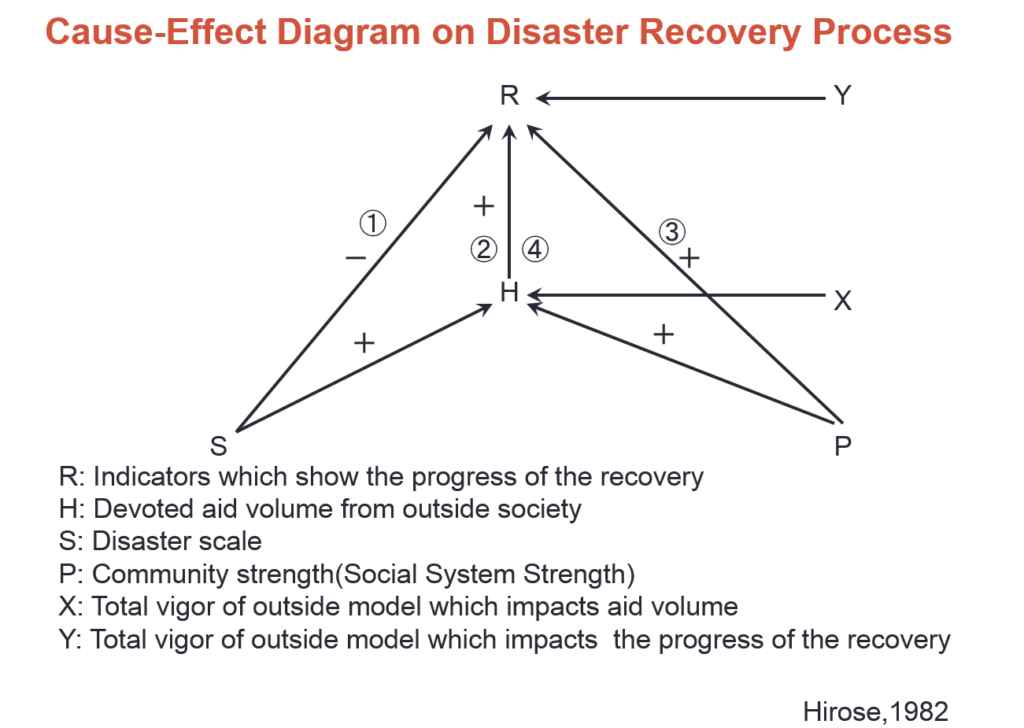
The disaster Process is influenced by
① Devoted aid volume from outside society
② Disaster scale
Community Strength (Social System Strength) (Hirose, 1982)
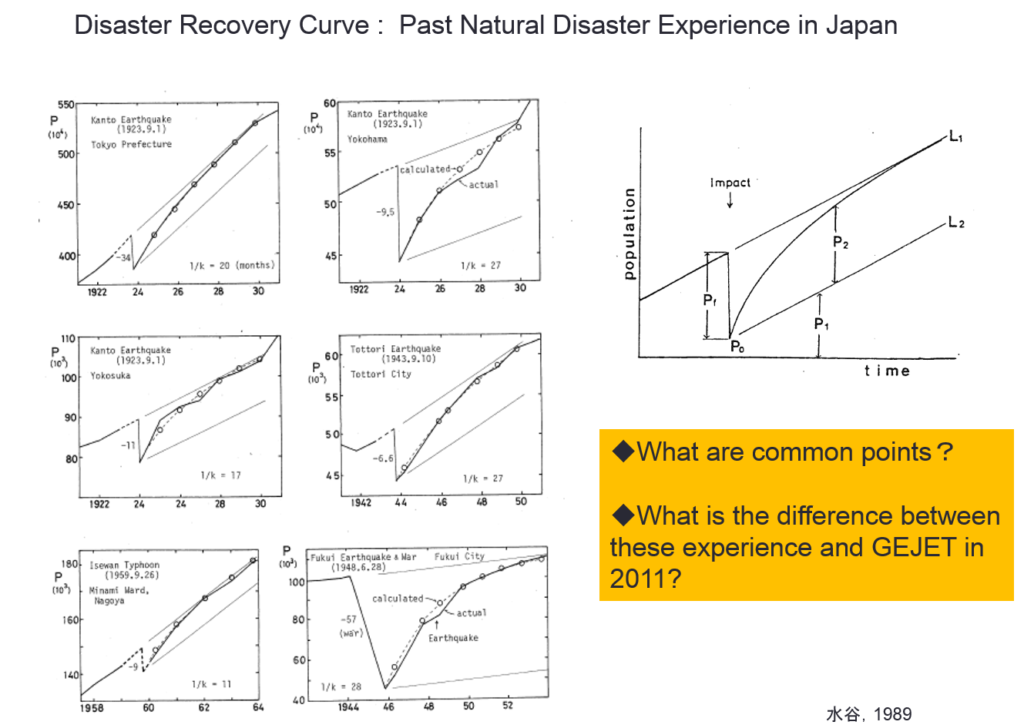
The first theory is confirmed by some cases. You can see the following figures: the Kanto earthquake, Fukui earthquake, Typhoon Isewan in Japan, and Hurricane Katrina in US. Figure 2: Disaster Recoveries in Japan
Figure 3: The Disaster Recovery from Hurricane Katrina in US.
To be continued…
This is the presentation summary. The presentation was made in 2011, after the tsunami in Japan.
I will update a column of the NIED e-mail magazine which I wrote a long time ago because the content is not faded with time. (I will do this step by step in Japanese and English.) I will also add comments to update the situation.
Published March 5, 2010 NIED-DIL e-mail magazine: Recoveries from Disasters
■ Disaster Recoveries ■
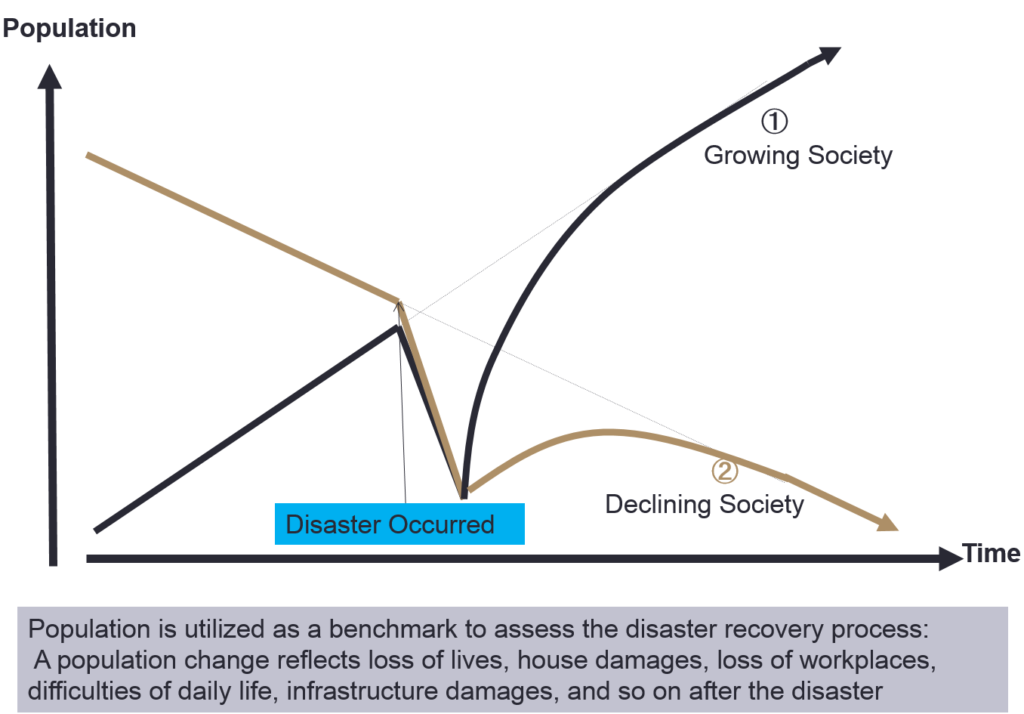
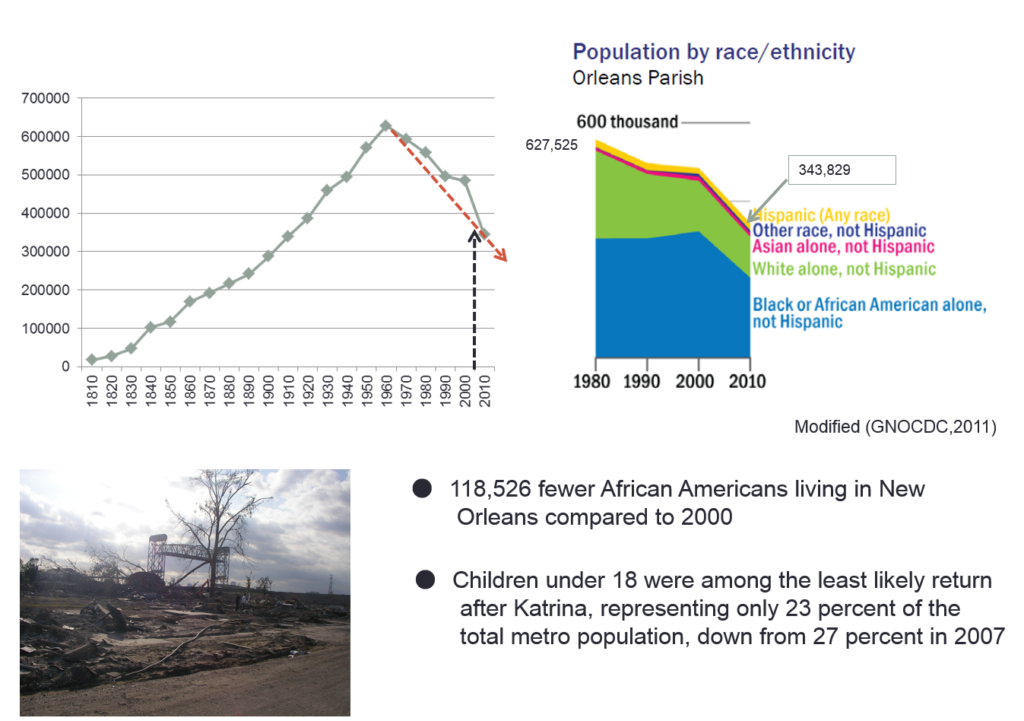
Global attention is being focused on how recovery will take place after the Haiti earthquake. I have studied a lot about disaster recovery. Still, as a valid theory of thinking, a researcher named Haas says, “A rapidly growing city will recover quickly after the disaster but will remain unchanged, and stagnant or downhill cities will recover very slowly after the disaster or will quickly decline “(1977). When considering what kind of area or growing city it is in this case, the population before the disaster could be examined as an indicator. I’ve researched a lot and predict that no matter how massive the distraction, an area with a growing population may be easier to recover. For example, in the city of Nagoya, due to the Typhoon Ise Bay disaster, the scale of economic and social damages was plentiful, and the amount of aid was small, but it was said that it was revived in less than a year. In comparison, the scale of economic and social disasters in New Orleans due to the Hurricane Katrina disaster was not so large, relative to statistics, but the amount of aid was enormous. Nevertheless, it may be useful to say that five years have passed and that recovery has not yet been good. New Orleans was even expressed as a surviving city, even before the disaster. Regarding the recovery of the stricken area of the Indian Ocean tsunami, it is not clear here, but there were many similar trends.
Let’s return to the example of Haiti. Examination of the population growth rate in Haiti (Port-au-Prince) showed that it was overgrowing until the disaster occurred. Haiti’s revival should be relatively quick, given the population index alone. However, it is also possible that Haiti has an entirely different social situation that cannot be applied to the above example. You may have to think that Haiti’s revival will be heavily influenced by the very elusive variables of political steering and social conditions. There is an article in the magazine “ Economist ” that fears that similar problems may occur in Haiti, such as the problem of contributions and aid in the Indian Ocean cases where oversupply was unevenly distributed and the damage was widened.
What do you think of Haiti’s recovery?
P.S.
The data below indicates a lot about the theory.
Based on the disaster recovery theories as mentioned before in Day_92, A Okushiri town’s disaster recovery could be predicted, however, the town still has a lot of difficulties in the disaster recovery process. This was shown in Day_75.
https://disasterresearchnotes.site/archives/2921
https://disasterresearchnotes.site/archives/2753
Figure 1 Demographic Changes in Okushiri Town
The 1993 southwest-off Hokkaido earthquake hit Okushiri Island severely. Casualties are 198 (including the missing number)and the economic damage indicator mentioned in the above is 0.03(Day_92). This means human suffering is relatively high however economic damage is not so high to the country. However, aid volume from outside is 14.4 percent, as the indicator, and this is so outrageously huge compared to disasters in Day_92. This can be said in the reflection of the Japanese economic situation during the time.
Okushiri town had faced population decreasing and aging issues before the disaster. After the disaster, Okushiri town had a lot of aids, especially from the inside of Japan. Japan had a very good economy at that time, so the situation enabled them to have such huge aids. Even though the large economic assistance, the town’s demographic tendency before the disaster was facilitated and faces a severe recovery process.
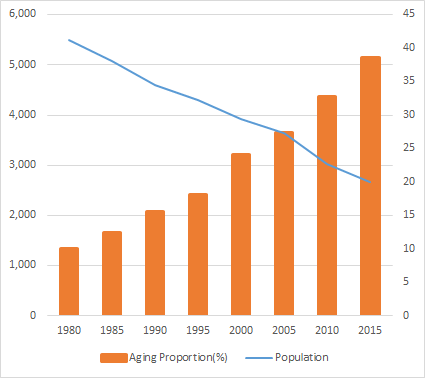
The population was dropped to the 2nd worst in Japanese municipalities between 2005 and 2010 after the disaster. Okushiri’s population was decreasing before and after the disaster, for example, 27.4 percent decreasing from 1990 to 2009. In addition, the population of the island had a declining tendency before the disaster and this was facilitated by the disaster. The decreasing population before the disaster can be confirmed as 5,490 in 1980 and 4,604 in 1990, this means 16 percent decrease.
The aging proportion increased two times from 1990(15.6) to 2010(32.7). The aging proportion (over 65) before the disaster was increased from 10.0 percent in 1980 to 15.6 percent in 1990. The Japanese economy was expanding at the time and a huge amount of aid was coming to the town from outside and installed, however, this Okushiri town’s case supports the recovery theory(Figure 1).
Over 20 years after the disaster, Okushiri town gives us a lot of lessons. The followings are the points that we can learn from the lessons to build a resilient society in demographic challenges.
1. Financial aids allocations: balancing soft and hard countermeasures
2. A Long perspective on the disaster recovery process
Concerning the Financial aids allocations, a huge amount of financial assistance rushed to the town, however, the assistance went to the infrastructures, building houses, purchasing fishermen’s ships, and so on to help the people’s lives in the town after the disaster. This shows more emphasis on the reconstruction than the recovery.
With respect to the recovery process, they tend to miss a long perspective. The people in the town could rebuild their houses and purchase new fishermen’s ships. Infrastructures are also rebuilt after the disaster. However, they have had not so attractive industries which the younger generation would like to work and remain in the town to live their lives. The Okushiri becomes high resistance against the disasters town, however, the population is decreasing and aging is facilitating dramatically. This means not so high resilient town. In addition, the cost of infrastructure maintenance will be a burden for the town in the long run.
The followings are the two disaster recovery theories used for this study.
1) Theoretical framework 1
Disasters contribute to change, they do so primarily by accelerating trends that are already under way prior to impact <Bates et al.(1963);Bates(1982);Bates and Peacock (1993)><Haas et al.(1977)>
2) Theoretical framework 2
Disaster Recovery Process is influenced by
① Devoted aid volume from outside society
② Disaster scale
③ Community strength (Social System Strength) <Hirose (1982) >
The first theory was already explained.
Concerning the second theory, the following Figure 4 can be referred. Figure 4 Disaster Recovery
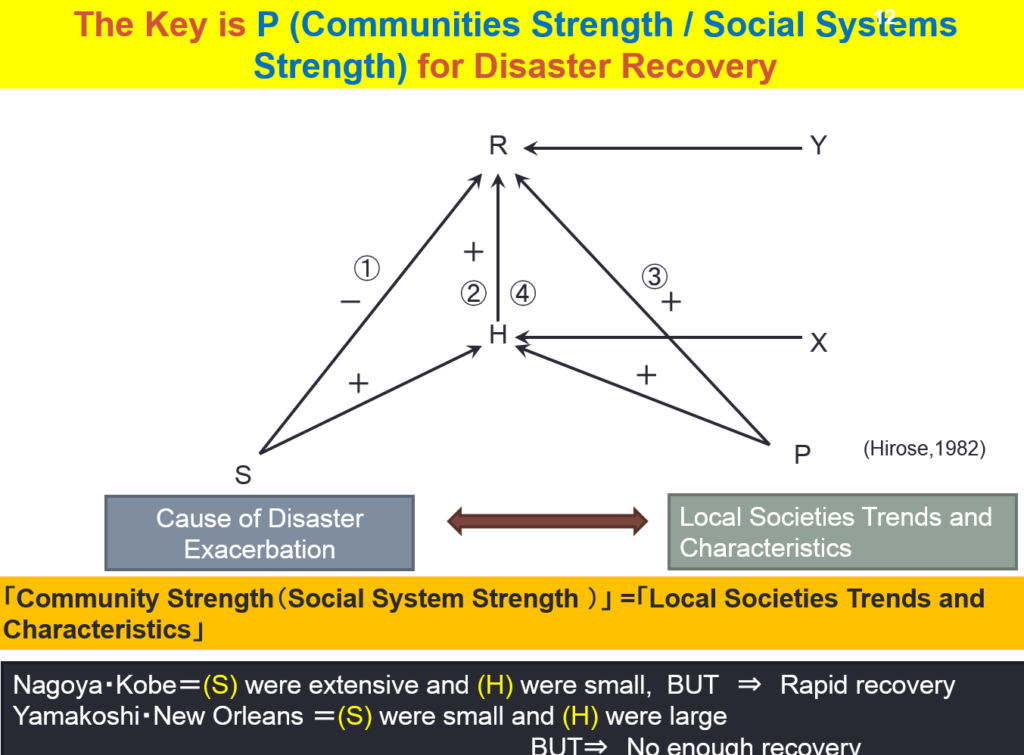
The disaster recovery progress is influenced by the following three indicators: S, Disaster scale, H, devoted an aid volume from outside society, and P, community strength(social system strength). For example, the large scale disaster has a high S which makes the recovery progress slow (Figure 2 indicates ①minus).
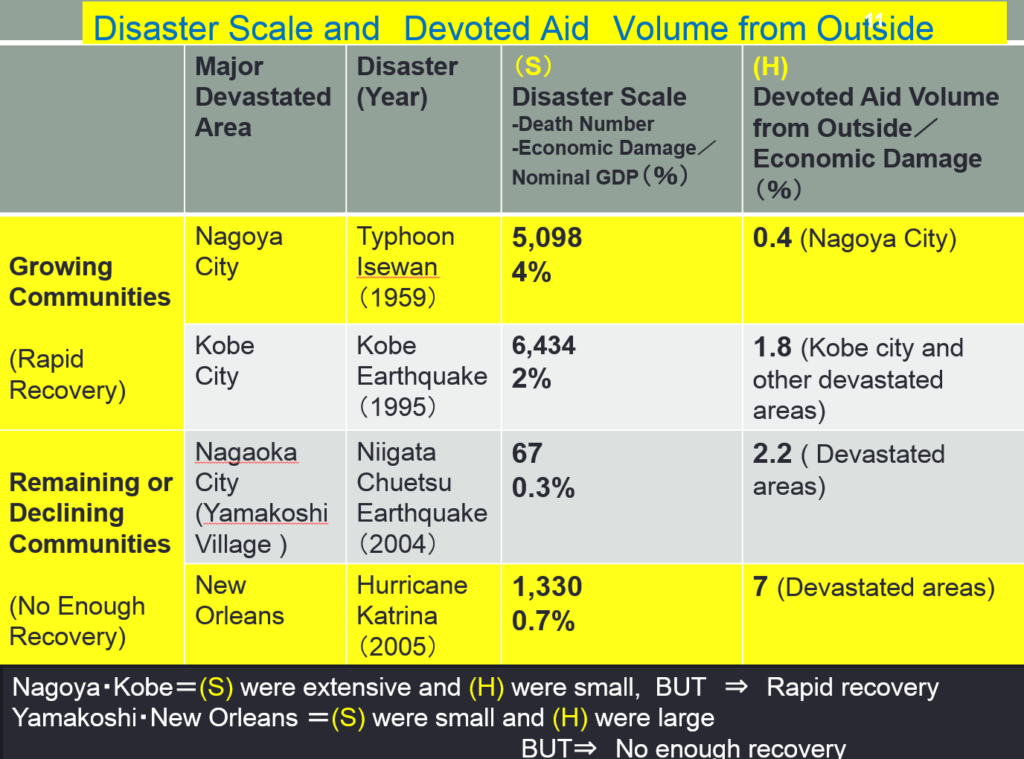
Table 1 Four Cases
The above Table 1 explains four disaster cases. Two growing communities before the disaster such as Nagoya city destroyed by Typhoon Isewan and Kobe city hit by Kobe earthquake.The other two were declining communities such as Nagaoka city (Yamakoshi village) affected by the Niigata Chuetsu earthquake and New Orleans devastated by Hurricane Katrina.
sponsored link
As you can see the above Table 1, Nagoya and Kobe have recovered rapidly after the disaster even if they had extensive Ss (disaster scales) with small Hs (help, aid from outside).
On the contrary, Yamakoshi and New Orleans have not recovered well after the disaster even if they had small Ss with large Hs.
Figure 5 Community Strength (Social System Strength)
Therefore, we can recognize the P(Community Strength) is the key indicator to influence the progress of the disaster recovery as shown in Figure 5.
I once proposed a model for analyzing relationships between natural disasters and society, a cyclic model of development-environment-disaster. This provides a long-term perspective and an overhead view for examining natural disasters. This analytical framework could expand on previous research from the viewpoints of the nexus between development and environment and also development and disasters. This also makes it possible to consider the relationships between development, environment, and disasters and the process from the disaster to the victims and from the disaster back to development.
Not only that, but this circular thinking method also provides viewpoints of circulation, opposite direction, cycle speed, time, development stage, and so on. Moreover, this framework provides foresight into considering relationships, not only for development, environment, and disasters in terms of domestic views but also for two or more countries. This is effective for grasping the meaning of natural disasters in the social context. In other words, this framework makes it possible to stimulate sociological imagination and to visualize the issues.
I actually analyzed the Typhoon Iwean disaster in 1959, the Indian Ocean Tsunami disaster in 2004, and the Great East Japan Earthquake and Tsunami disaster in 2011 with this framework. However, these works are only in Japanese.
Day 14 shows disasters can be categorized into natural, technological, and human-made disasters. Natural disasters can be considered a relationship between humans and nature. Technological disasters come from the interactions between humans and technology that people create. The conflicts between humans and humans cause human-made disasters. This idea is the basis for understanding natural disasters. The 2011 Fukushima nuclear plant issue is a technological disaster and a natural disaster, so we can call it a complex disaster. These understandings are based on what I learned before.