Two Earthquakes
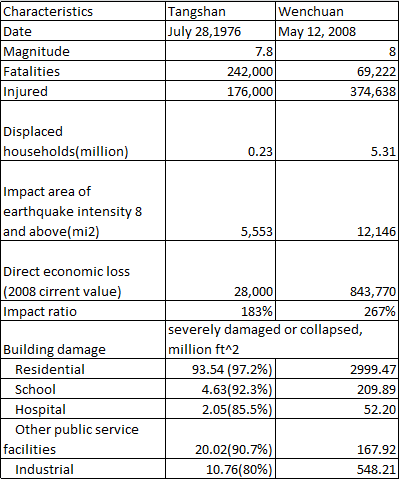
Yang Zhang William Drake, et al. (2016)* indicates interesting views on two earthquakes disaster recoveries, the 1976 Tangshan earthquake and the 2008 Wenchuan earthquake. The point is, why the 2008 Wenchuan earthquake recovery was so rapid compared to the 1976’s earthquake.
However, the paper could add more about the total background changes of China such as society, economy, and politics. The china has changed dramatically after the 1976 from historical viewpoints.
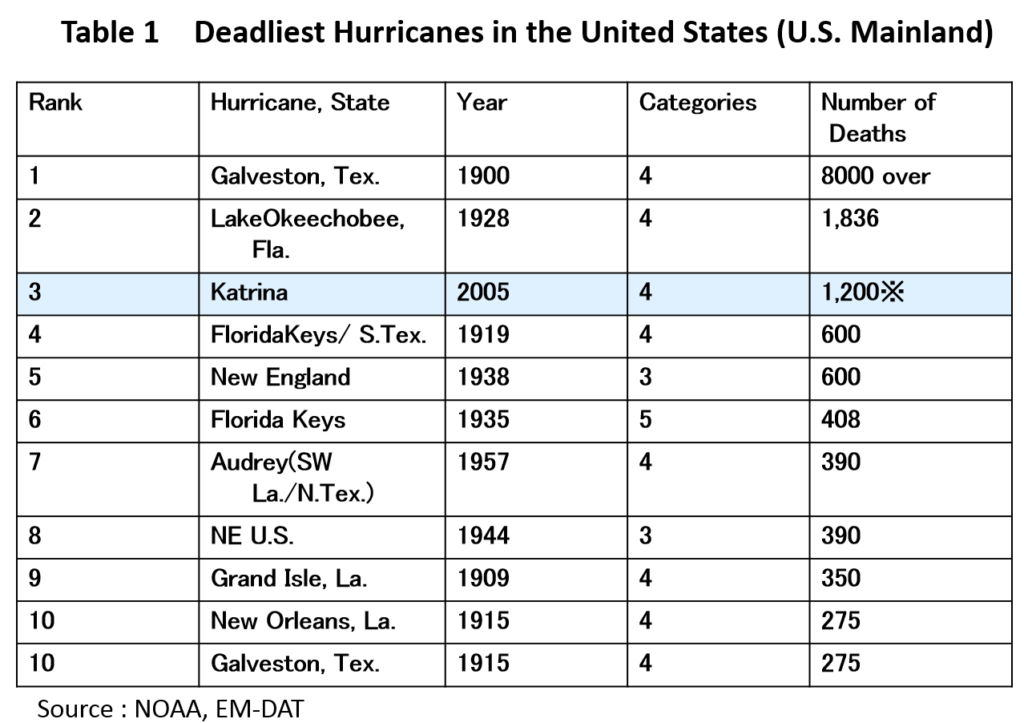
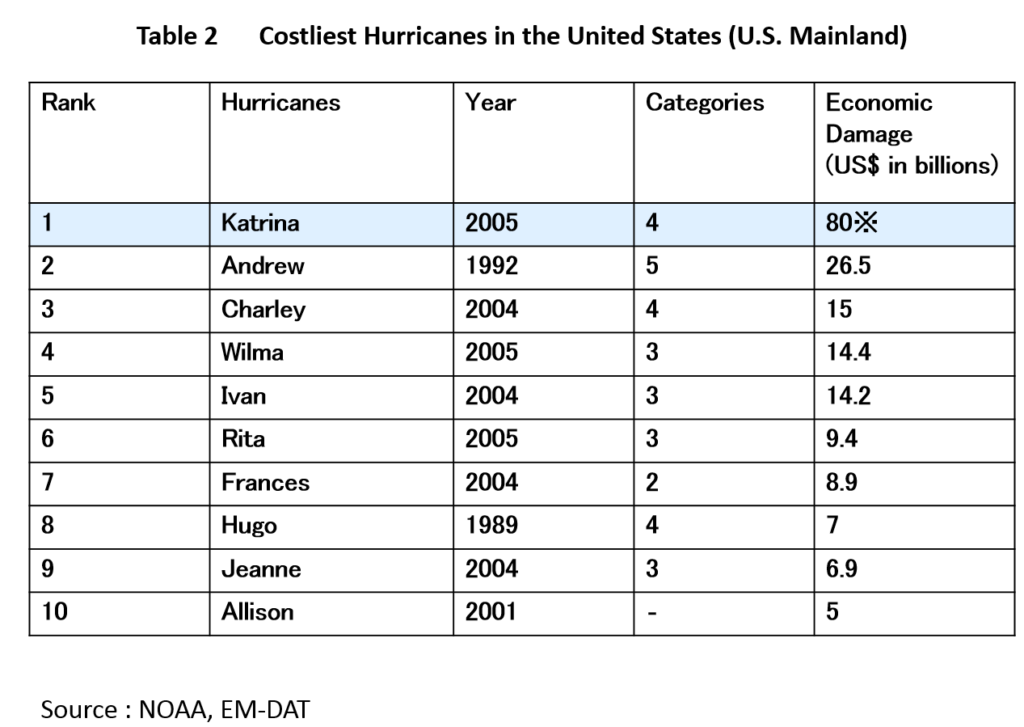
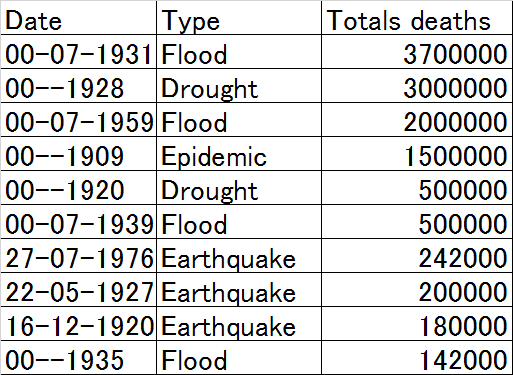
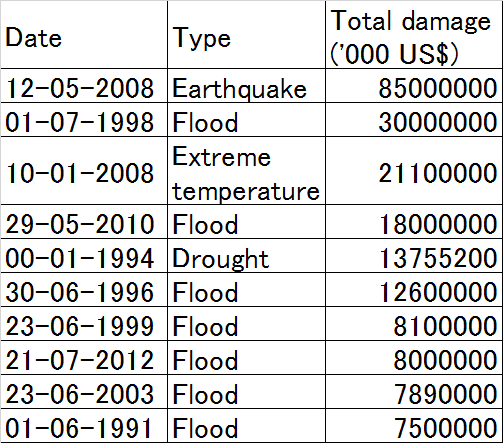
The Tangshan earthquake is one of the deadliest disasters in the world and the Wenchuan earthquake is one of the top ten costliest disasters in the world also. Munich Re ranked the Wenchuan as the top four costliest disaster after the Japanese Tsunami (2011), the Hurricane Katrina (2005). and the Kobe Earthquake (1995). The number of deaths caused by the Tangshan is still controversial because of the Chinese government’s political climates at the time.
A Comparison of the two earthquakes
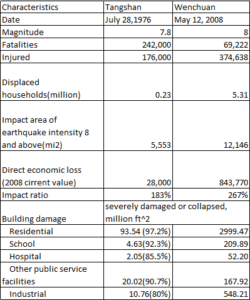
Yang Zhang William Drake, et al. (2016)
The Rapid Disaster Recovery after the 2008 Wenchuan earthquake
Yang Zhang William Drake, et al. (2016) describes the following points, historical and socio-economic contexts, why the 2008 Wenchuan earthquake recovery was so rapid compared to the 1976’s earthquake.
[Historical context]
- The Chinese government drew lessons from its handling of the Tangshan earthquake recovery. The government emphasized the importance of planning for coordinated reconstruction.
- China had established a strong planning institution to support its rapid growth agenda since the economic reform began in the late 1970s. The contrast of recovery planning between the two earthquakes highlights the notion that a pre-existing planning institution and pre-existing policy documents that describe development visions for a disaster area.
[Socio-economic context]
- China’s ability to promptly fund the earthquake recovery was far superior in the 2000s. China’s annual GDP in the year prior to the Wenchuan earthquake was 3.494 trillion USD 2007, which was 22 times its GDP in 1975.
- The earthquake happened less than three months before the Beijing Olympic Games. It was in the government’s best interest to move swiftly with the response and recovery to ensure social stability for the Olympic Games.
- The global economic downturn of 2008 might have also played a role in speeding up the earthquake recovery. To stimulate the economy, heavy investment in the earthquake recovery became a convenient policy option.
However, many things can be added about the above points such as the acceptance of international aids (Day_95).
http://disasters.weblike.jp/disasters/archives/2971
This rapid recovery from Wenchuan reminds us the Japanese historical trends from 1945 to 1959, especially after the Typhoon Isewan in 1959. The Haiti’s cases, 2010 Earthquake and 2016 Hurricane Matthew also can be found as the same analogy (The below related articles across the web).
The Meanings of the Lessons
We cannot experience the disasters so often, of course, we do not want to have disasters. This is why we should learn from the past disasters and this is what we can do all the time.
*Yang Zhang William Drake, et al. (2016) Disaster Recovery Planning after Two Catastrophes: The 1976 Tangshan Earthquake and the 2008 Wenchuan Earthquake, International Journal of Mass Emergencies and Disasters, 34(2):174-203
[ad#ads1]


 .
.