Cyclone」カテゴリーアーカイブ

Day_192 : What are the differences between cyclones, typhoons, and hurricanes?

The terms cyclone, typhoon, and hurricane all refer to the same meteorological phenomenon but are used in different regions of the world. They describe a large, violent tropical storm system with strong winds and heavy rain. Here are the distinctions:

  1. Cyclone is the term used in the South Pacific and Indian Oceans. The word “cyclone” is also used in a broader sense to refer to any circulating weather system over the ocean characterized by closed isobar patterns and circular wind movement, whether tropical or not. In the Indian Ocean and South Pacific, when the system reaches sustained wind speeds of at least 74 miles per hour, it is called a tropical cyclone.
  2. Typhoon is the name given to these storm systems in the Northwest Pacific Ocean, typically west of the dateline. Like hurricanes and cyclones, a typhoon forms over warm tropical oceans and gains energy. When the sustained winds in this system reach or exceed 74 miles per hour, it is officially referred to as a typhoon.
  3. Hurricane is the term used in the North Atlantic, Central, and Eastern North Pacific oceans. The criteria for being classified as a hurricane are the same as for typhoons and cyclones, with sustained wind speeds of at least 74 miles per hour.

The naming convention is primarily geographical. The structure and behavior of these storms are the same, and they all belong to the category of tropical cyclones. The difference in nomenclature does not imply a difference in the hazard or potential damage these storms can cause, which is primarily dependent on their size, strength, and the area they affect.

A condensed list of references to support the distinctions between cyclones, typhoons, and hurricanes:

  1. The World Meteorological Organization (WMO) provides official definitions and classifications for tropical cyclones, typhoons, and hurricanes based on regional basins.
  2. National Hurricane Center (NHC) and Central Pacific Hurricane Center (CPHC): Part of the United States’ National Oceanic and Atmospheric Administration (NOAA), these centers offer detailed information on hurricanes, including the distinctions between hurricanes, typhoons, and cyclones.
  3. The Australian Bureau of Meteorology (BOM) offers insights into cyclones, especially in the South Pacific and Indian Ocean regions, detailing their formation, classification, and impacts.
  4. Japan Meteorological Agency (JMA): Provides information on typhoons, their tracking, and impacts in the Northwest Pacific region.
  5. Indian Meteorological Department (IMD): Offers comprehensive data on cyclones in the Indian Ocean, including classifications and warnings.

These organizations are key in tracking, studying, and providing information on these storm systems worldwide. They use specific criteria for wind speeds, atmospheric pressure, and other factors to classify these storms according to the region they occur in.

Day_167: Imagine from Disaster Damage Statistics

NIED-DIL mail magazine: 6
Imagine from disaster damage statistics
Contribution day and time: 2013/08/19

There is an index called the World Risk Index. The world risk report ranks Bangladesh as one of the high-risk countries in the world in 2019.

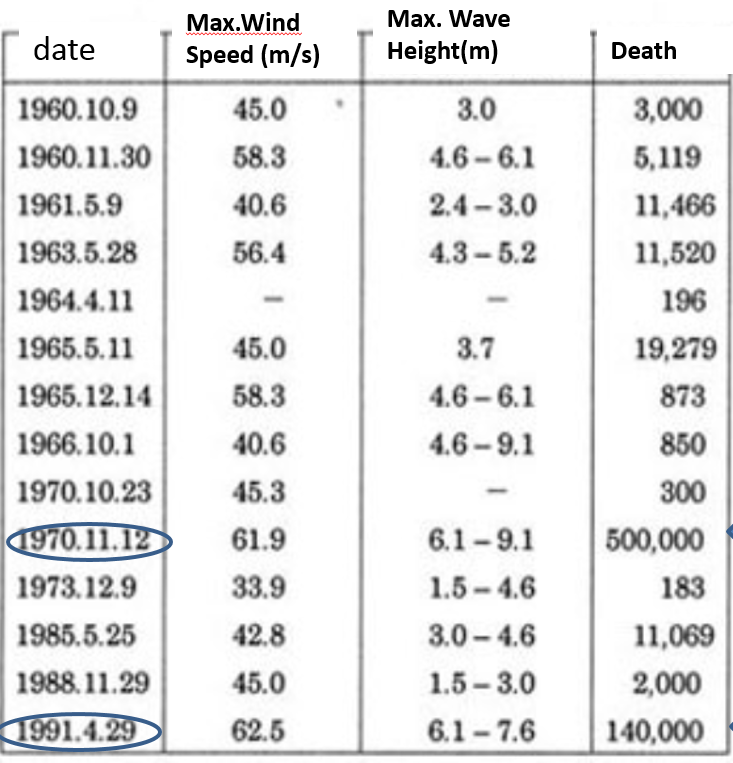
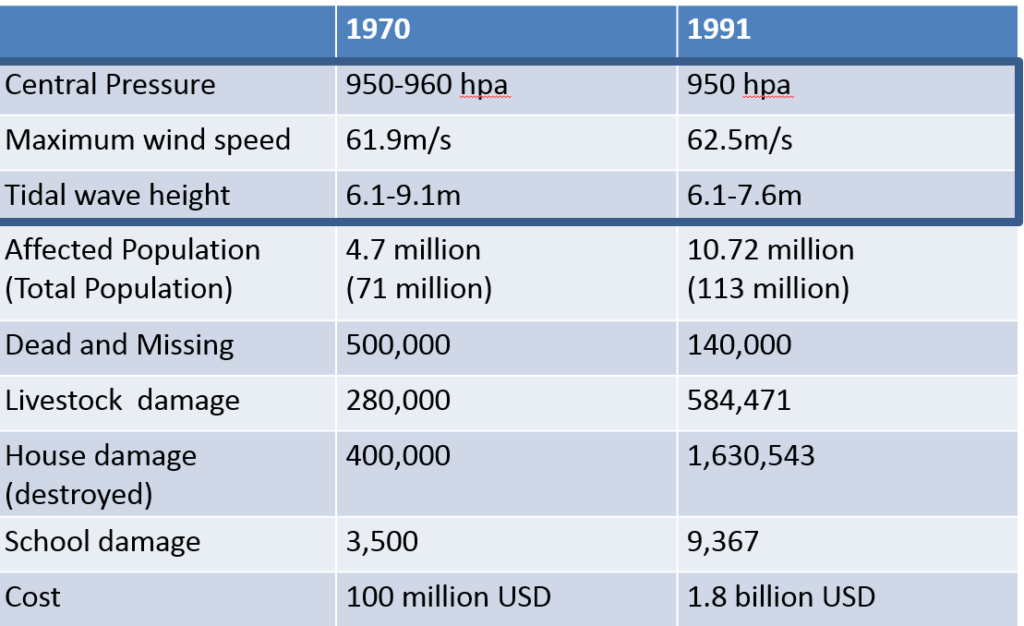
Indonesia and Haiti were easy to imagine, linked to the damages caused by recent earthquakes. Previously, there was an opportunity to learn from a land environment perspective about the past major disasters that struck Bangladesh, especially the large-scale cyclone disasters in 1970 and 1991. During a study session at the institution, I leaned the reported number of the casualties caused by the disasters was 500,000 and 140,000 people each. I was surprised to see the large numbers, but I was wondering why these numbers are so rough. When I looked at the table showing the breakdown numbers, I felt, “Oh!”

Building damage, human suffering, and livestock damage are listed. For example, the cyclone disaster in 1991 resulted in 1,630,543 house damage, 140,000 human suffering (dead or missing), and 584,471 livestock damage.

Yes, human suffering seemed to be a rough figure, while house damage and livestock damage were written down to one digit. And when we looked at what kind of country Bangladesh was like such as caste, religion, and livestock.

The background of the numbers, such as meaning, etc., has come into view. Regarding the number of dead and missing people in 1970, there are no accurate figures, and reports from 200,000 to 550,000 people have been reported in various fields.

https://disasterresearchnotes.site/archives/3224

When there is a disaster, numbers about the damage come out, but I thought it was a very important viewpoint to think about where the numbers came out and what you can imagine from those numbers.

By the way, the web site is
https://reliefweb.int/sites/reliefweb.int/files/resources/WorldRiskReport-2019_Online_english.pdf
Issued July 5, 2010 No. 6

Related Books and Info. for Further Understanding

sponsored link

Day_142 : World Disaster Chronology-1994-1995


Date Place Disaster Type Situations
1994.01.17 US, Southeastern Inland Earthquake 1994 Northridge earthquake *
M6.8, 60(D), one of the costliest natural disasters of US history
1994.02.15 Indonesia, West (Sumatra Island) Inland Earthquake M6.6~7.0, Over 200(DM)
1994.05- Bangladesh Cyclone Over 170 (DM)
1994.05.13 Afghanistan Inland Earthquake M6.0, Over160(DM)
1994.06- India / Pakistan Heat Wave Over 400 (D)
1994.06- Ethiopia Drought Over 5,000(D), Food shortage
1994.06- China, Central eastern Heavy Rain, Flood Over 700(DM), A part of Shanghai was inundated
1994.06.02 Indonesia, South (Java Island) Submarine Earthquake M7.8、死不270以上、津波。
1994.06.06 Colombia, South Inland Earthquake M6.6, 300-800(DM), Debris flow
1994.06.09 Bolivia, Peru Deep-focus Earthquake 1994 Bolivia earthquake M8.2 10(D)
1994.07- Rwanda Heat Wave Over 10,000(D), combined with Civil War
1994.08.18 Algeria, North Inland Earthquake M5.7, Over 150(DM)
1994.10.04 Japan, Kunashiri Island Submarine Earthquake The 1994 Hokkaido Toho Oki Earthquake M8.2-8.3, 15(DM), Tsunami
1994.11- India South Cyclone 190(DM)
1994.11.14 The Philippines Inland Earthquake M7.1 Over70(DM) Tsunami
1994.11- Italy Heavy Rain, Flood Over 60(DM)
1994.11- Egypt Lightning 560(DM) Lightning damage to Oil facilities
1994.11- Haiti, Cuba Hurricane, Flood Over 700(DM)
1995.01.17 Japan Inland Earthquake The 1995 Great Hanshin Awaji Earthquake * M6.9~7.3 5,500~6,400(DM)
1995.03- Afghanistan Heavy Rain, Flood, Landslide Over 360(DM)
1995.04- Bangladesh Strong Wind 700(DM)
1995.05.27 Sakhalin, North Inland Earthquake The 1995 Neftegorsk earthquake,M7.1~7.5, Over 1,989(DM) Neftegorsk city was destroyed and vanished from the map after the disaster
1995.05- Brazil Heavy rain, Flood. Landslide Over 80(DM)
1995.05- China Heavy rain, Flood Over 1,100(DM), Yangtze river flood
1995.06- India, Pakistan Heat Wave Over 800(D)
1995.06- Japan Heavy rain, Flood 9(DM), Destroyed Approx.200, Inundated over15,000
1995.07- US Heat Wave Over 800(D)
1995.07- D.P.R.Korea Heavy rain, Flood Over 60(DM)
1995.07- Thailand Heavy rain, Flood Over 200(DM)
1995.08- Morocco Heavy rain, Flood Over 150(DM)
1995.9- The Philippines Heavy rain, Flood Over 540(DM)
1995.11- The Philippines Typhoon, Flood Over 780(DM)
1995.12-  Kazakhstan Cold Wave Over 100(DM) Snowstorm

D: The number of Death M: Missing number DM: The dead and missing number

https://disasterresearchnotes.site/archives/2831

Related articles across the web

Day_118 : World Disaster Chronology-1982-1988


Date Place Disaster Type Situations
1982.01- US and Europe Cold Wave Over 350(DM)
1982.01- Columbia Heavy Rain, Flood 90(DM)
1982.01- Peru Heavy Rain, Flood Over 3,000(DM)
1982.03- Philippines Typhoon Over 90(DM)
1982.03- Mexico, South Volcano  Mt. El Chichon Volcano Eruption, Over 150(DM)
1982.04- Peru Heavy Rain, Flood Over 200(DM)
1982.05- China Heavy Rain, Flood Over 430(DM)
1982 Nicaragua and others Heavy Rain, Flood 180(DM)
1982.06- Indonesia, WestSmatra Heavy Rain, Flood Over200(DM)
1982.06- India, Southeastern Heavy Rain, Flood 200-1,000(DM) Orissa
1982.07- Japan, Kyusyu Heavy Rain, Flood 1982 Nagasaki Heavy Rain Disaster,345(DM), Injured 660, Destroyed approx.850, Inundation over 52,000
1982.08- South Korea Typhoon, Flood Over 60(DM)
1982.08- Japan, Central Typhoon, Flood 95(DM), Injured170, Destroyed approx.5,300, Inundation over 113,000
1982.09- Japan, Central Typhoon, Flood 38(DM),Injured 170, Destroyed approx.600, Inundation over136,000
1982 Guatemala and others Heavy Rain, Flood Over 1,500(DM)
1982.10.06 Liberia  Landslide Over 200(DM)
1982.11- India Typhoon, Flood Over 270(DM)
1982.12.13 Yemen Inland Earthquake 1982 North Yemen earthquake, M5.8, 2,800-5,000(DM)
1983 Turkey, East Inland Earthquake Over 1,000(DM)
1983.02- Australia, Southeastern Forest Fire 75(DM)
1983.05.26- Japan, Northeastern Submarine Earthquake 1983 Sea of Japan Earthquake*,M7.7 104(DM), Injured160, Half Destroyed or more, over3,000
1983.07- Japan, Central Heavy Rain, Flood 1983 Heavy Rain,117(DM), Injured 160, Destroyed approx. 3,600, Inundation over 17,000, Damaged over 1.3mil yen
1983.09- Japan, Central Typhoon 44(DM), Injured 120, Destroyed approx. 600, Inundation over 56,000
1983.12- Japan Heavy Snow 96(DM), Destroyed approx. 900
1984.03.28 US Tornado The 1984 Carolinas tornado outbreak, 57(D)
1984.06.09 USSR Tornado The 1984 Soviet Union tornado outbreak. Over 400(D)
1985.03.03 Chile, Central Submarine Earthquake M7.8-7.9, 180(DM)
1985.08.23 China, Xinjiang autonomous region Inland Earthquake M7.3, Over 80(DM)
1985.09.19 Mexico, Southwestern sea (Mexico city) Submarine Earthquake 1985 Mexico city earthquake, M8.1,9,500-35,000(DM)
1986.08- Japan, Kyusyu and others Typhoon, Flood 21(DM), Injured100, Destroyed approx.2,600, Inundation over 105,000
1986 El Salvador Inland Earthquake 1986 San Salvador earthquake M5.5-5.8, Over1,000(DM)
1986.10.20 Kermadec Islands Submarine Earthquake M7.7-8.2
1987.03.06 Ecuador, South Inland Earthquake Ecuador Earthquake (M6.7-7.1) 1,000~5,000 (DM)
1987.10- Japan, West Typhoon, Flood 9(DM), Destroyed approx.200, Inundation over 24,000
1987.12.17 Japan, East Submarine Earthquake Chiba Ken Toho Oki Earthquake,M6.7,2(D), Injured 160
1988.02- Mozambique Cyclone, Flood Cyclone Filao, approx.100(D)
1988.07- Japan, Kyusyu and others Heavy Rain, Flood 27 (DM), Injured 60, Destroyed approx.600, Inuncation over 10,000
1988.08.21 Nepal   1988 Nepal earthquake M6.9,  killing at least 709 persons and injuring thousands.
1988.11- Bangladesh Cyclone, Flood 6240(D) One of the worst tropical cyclones in Bangladeshi history. 
1988.09- Mexico, and others Hurricane Hurricane Gilbert, 318(D)
1988.10- Caribbean and Central America Hurricane Hurricane Joan–Miriam, 216-334(D)
1988.10- Guam, Marianas Islands, Philippines, China Typhoon Typhoon Ruby, Over 300(D)
1988.11.06 China and Myanmar Inland Earthquake M7.0-7.3, Over 700(DM)
1988.11.28 US, North Carolina and  Virginia  Tornado 1988 Raleigh tornado outbreak, 4(D),Injured 154
1988.12.07 USSR, South (Armenia) Inland Earthquake 1988 Armenian earthquake,M6.7-6.9, 25,000-45,000(DM)
Economic damage is 140 million dollar , worst earthquake disaster in USSR history

D: The number of Death M: Missing number DM: The dead and missing number

1983 Sea of Japan Earthquake*

https://disasterresearchnotes.site/archives/2722

Day_117 : Bangladesh-Disasters, Lands, and Statistics (2)

Bangladesh has had a lot of cyclone disasters in the history. Table 1 indicates
the past cyclone disasters. Especially, we can see the 1970 and 1991’s cyclone
disasters are severe and caused many casualties. The bellows are some reviews
of Day_110 contents.

Table 1 Cyclone disasters in Bangladesh

banglacyclonehistory.

Table 2 picked up two disasters. We can compare the two. What can we say about this? Affected population was tremendously increased from 1970 to 1991. On the contrary,
the dead and missing number was decreasing. How about 1991’s cyclone disaster?

Table 2  1970 and 1991’s cyclone disasters*
banglacyclone19701991

Please check the dead and missing number and livestock damage.
You may have a strange feeling. The dead and missing number is
so rough.  However, livestock damage number is so precise. This
could reflect the cultural and social backgrounds.

banglasand
Figure 1 Sandwip Island History

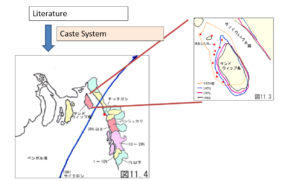
We can consider a caste system somehow to understand the number.
The Brahmaputra river from the east and the Ganges river from the west bring a lot of sand to make lands in the Bay of Bengal. The people had a low status tended to live there actually.
They are easily influenced by the cyclones. In other words, they tended to die by the events.
Figure 1 shows the land, such as a Sandwip island was changing its shape by cyclones.

banglashelter
Figure 2   1970 and 1991 cyclones

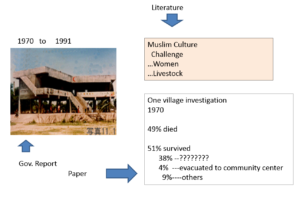
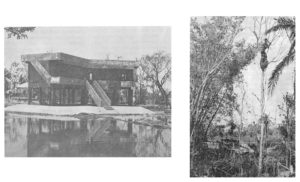
Figure 2 indicates the shelter which was built after the 1970’s cyclone (with JICA’s  scheme)
saved a lot of people’s lives. However, there were some cultural issues. For example, the shelter’s number was limited, so it was crowded in the shelter.  This situation made females difficult to evacuate to the shelter. They tended to avoid to stay with males in the crowded situation. The livestocks are treated as their important assets. This also reflects their culture.

The one of the research findings after the 1970’s cyclone show the  38% of the survivors were survived by climbing trees (Figure 3).

evacuationsbangla
Figure 3 A shelter and a people climbing the tree

* The sources(Figures) will be added later.

Day_110 : Bangladesh-Disasters, Lands, and Statistics (1)

Bangladesh has had a lot of cyclone disasters in the history. Table 1 indicates
the past cyclone disasters. Especially, we can see the 1970 and 1991’s cyclone
disasters are severe and caused many casualties.

Table 1 Cyclone disasters in Bangladesh*

banglacyclonehistory.

Table 2 picked up two disasters. We can compare the two. What can we say about this? The affected population was tremendously increased from 1970 to 1991. On the contrary,
the dead and missing number was decreasing. How about 1991’s cyclone disaster?

Table 2  1970 and 1991’s cyclone disasters*
banglacyclone19701991

Please check the dead and missing number and livestock damage.
You may have a strange feeling. The dead and missing number is
so rough.  However, livestock damage number is so precise. This
could reflect the cultural and social backgrounds.

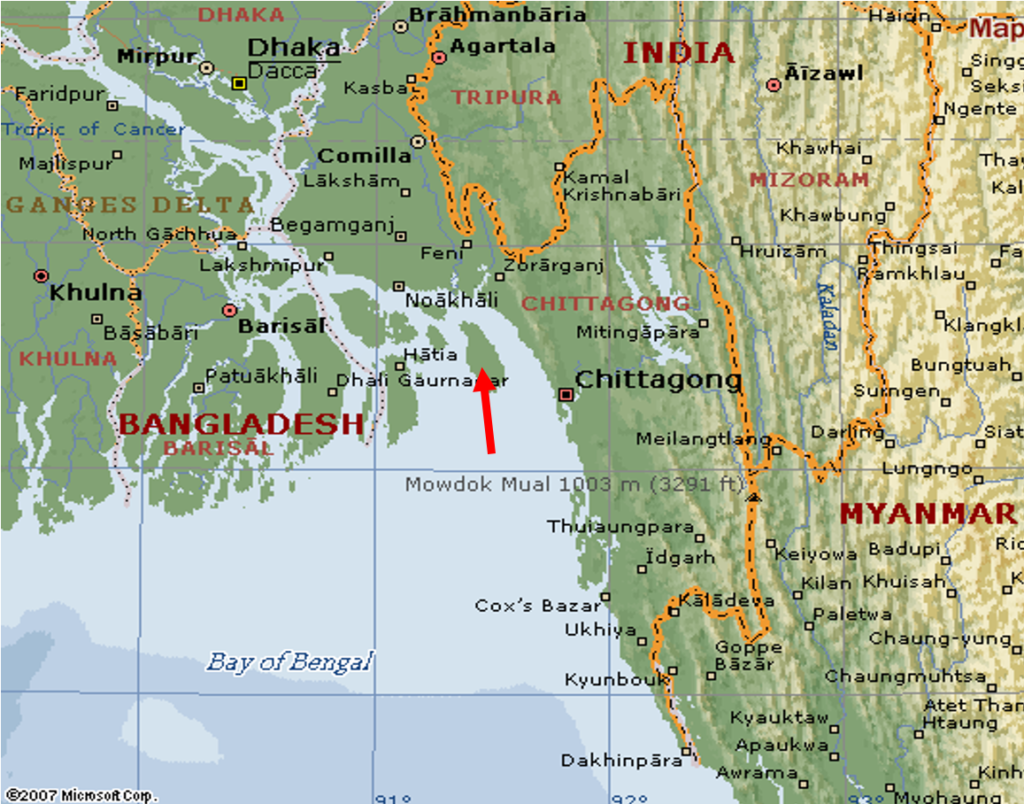
The 1991 cyclone hit Sandwip island and Chittagong city. Figure 1
shows the map.

banglamap
Figure 1  Sandwip Island and Chittagong (Map source: Microsoft Group)

To be continued…….
*Table 1 and 2 ‘s source will be mentioned later.

Related books and info. for further understanding


sponsored link

Day_106 : Myanmar-This week’s earthquake and the past trends

Myanmar had a huge earthquake (M6.8) on 24Aug2016.
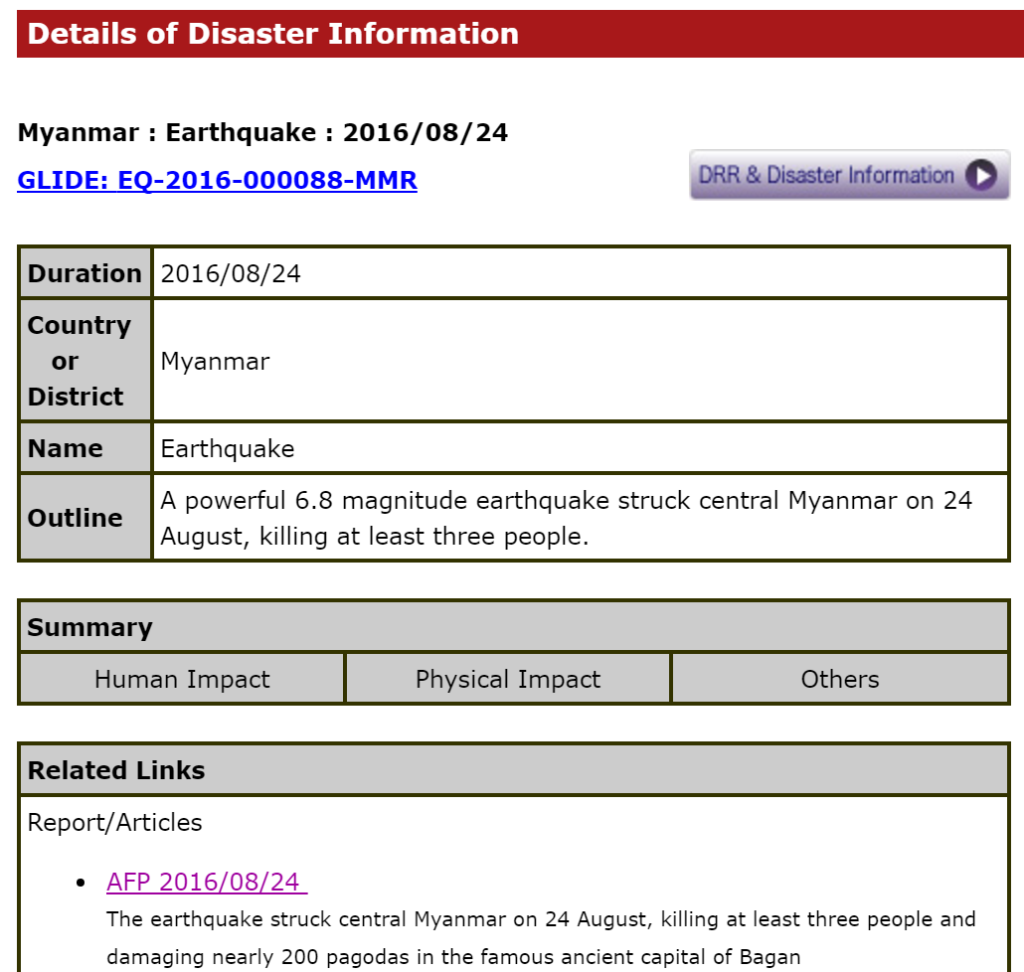
The outline of the information can be checked by the ADRC website (Figure 1).

Myanmar Earthquake
Figure 1  Myammar Earthquake 24Aug2016 (ADRC)

“A powerful 6.8 magnitude earthquake struck central Myanmar, killing at least three people and damaging nearly 200 pagodas in the famous ancient capital of Bagan. The quake was also felt across neighboring Thailand, India and Bangladesh, sending panicked residents rushing onto the streets (AFP).”

Let’s check the disaster data.
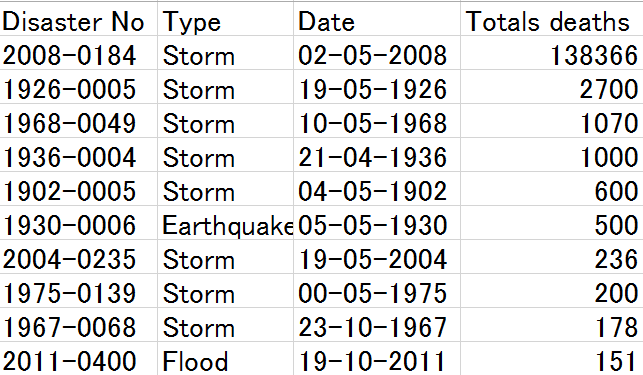
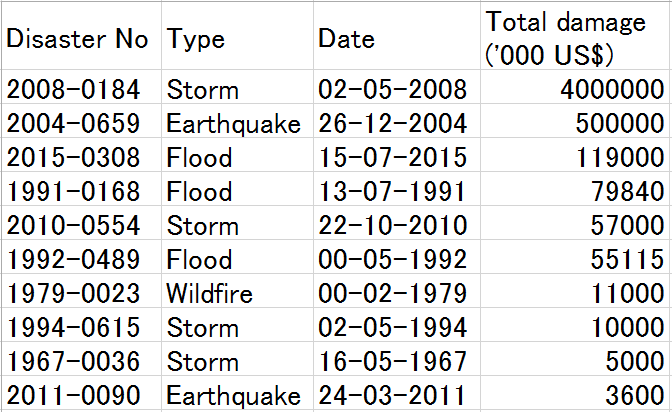
The Figure 2 Figure 3 are the 1900-2016 top 10 deadliest and costliest disasters  in Myanmar (EM-DAT).

Myanmar death toll 2
Figure 2 Totals Deaths (Top 10 deadliest natural disasters in Myanmar)

Myanmar economic damage 2
Figure 3 Total damage (Top 10 costliest natural disasters in Myanmar)

We can confirm how the 2008 Cyclone Nargis was influential.
Many natural disasters which have high total deaths numbers occurred before 2000 (7/10).  On the contrary, many high economic damage natural disasters hit after 1990 (8/10).  These facts support the following “disaster is from human suffering to economic damage with development process”.

The notes on the recent major events (ADRC) are as follows:

1) Cyclone Nargis (May 2008)
Cyclone Nargis hit Myanmar in May 2008 which killed 84,537, with the missing 53,836, injured    19,359. 450,000 houses were destroyed, with another 350,000 damaged. Total affected people     were 2.4 million. The total economic loss was US$ 4.1 billion (according to Post-Nargis Joint         Assessment- PONJA).

2) Indian Ocean Tsunami (December 2004)
Indian Ocean Tsunami occurred off the Sumatra Island on 26 December 2006 killed 61,                 injured 42, affected 2,592 and destroyed 601 houses in Myanmar.

*The numbers of deaths are not the same with different sources. This is the one of the most important challenges of disaster research.

We can especially consider the political conditions for understanding the 2008 Cyclone Nargis disaster exacerbations. During the disaster, the county had refused international aids.

[ad#ads1]