First, the theoretical examination’s concept is explained and two disaster recovery theories are introduced. Second, the first theory is explained and studied. Third, the second theory is explained and examined.
The concept is explained as follows:
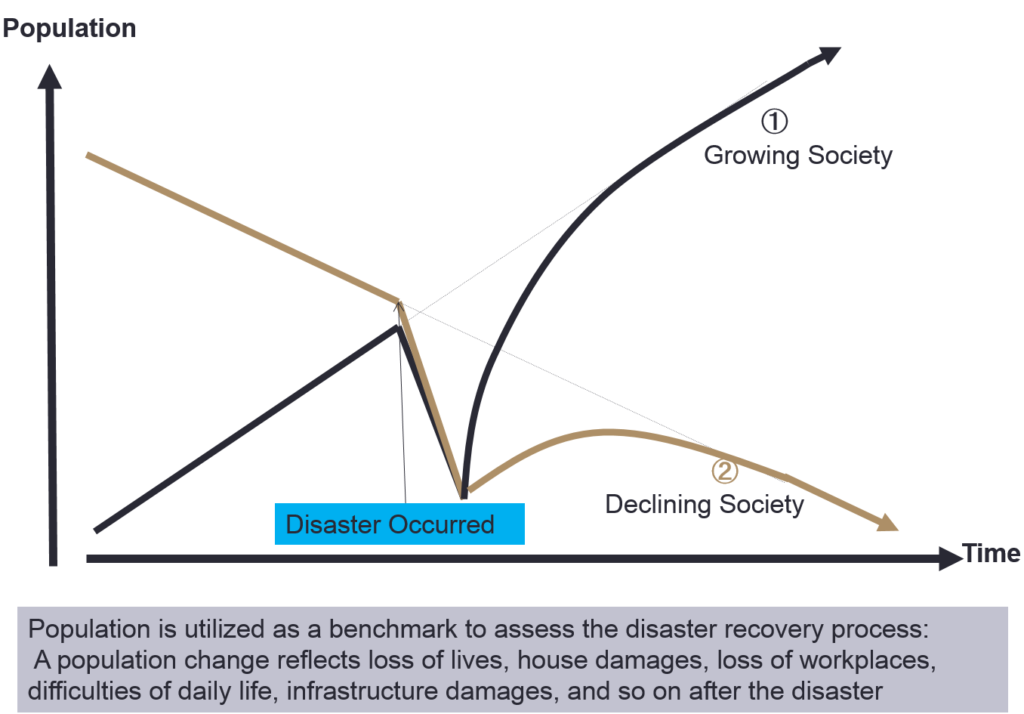
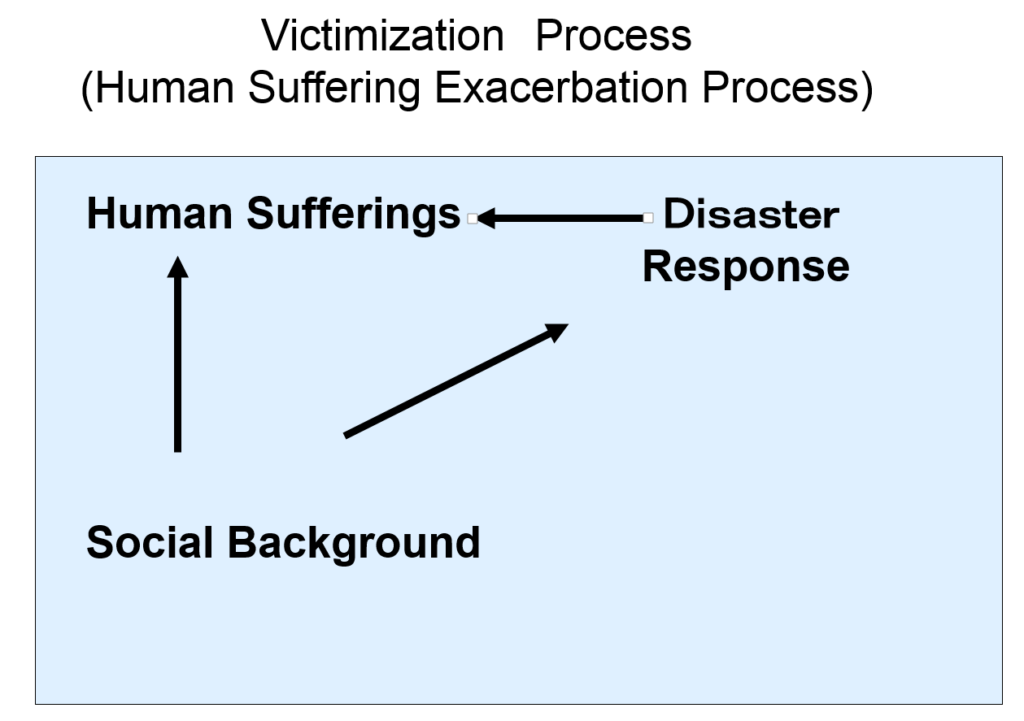
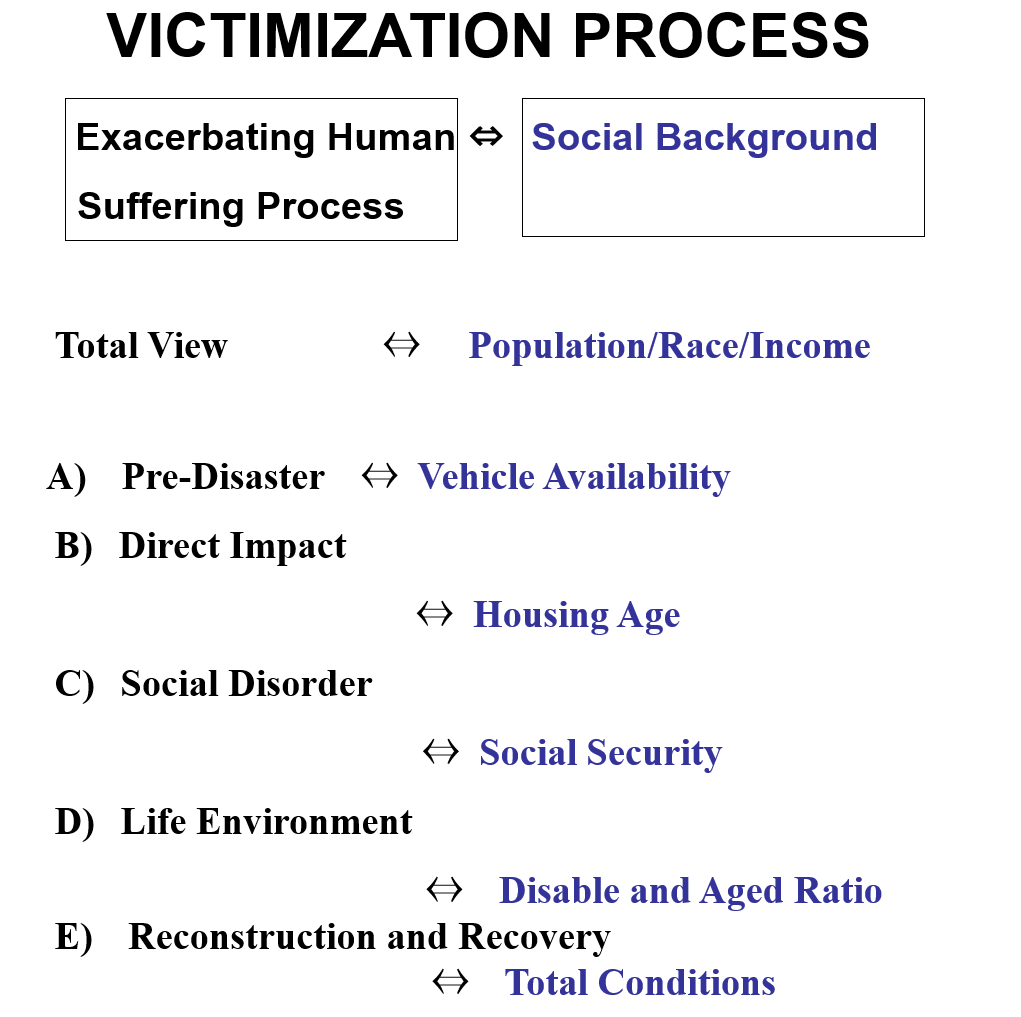
Figure1 1: Disaster Recovery Concept
The following are the two disaster recovery theories used for this study.
Theoretical framework 1
Disasters contribute to change, they do so primarily by accelerating trends that are already underway prior to impact (Bates et al., 1963; Bates, 1982; Bates and Peacock, 1993; Haas et al., 1977).
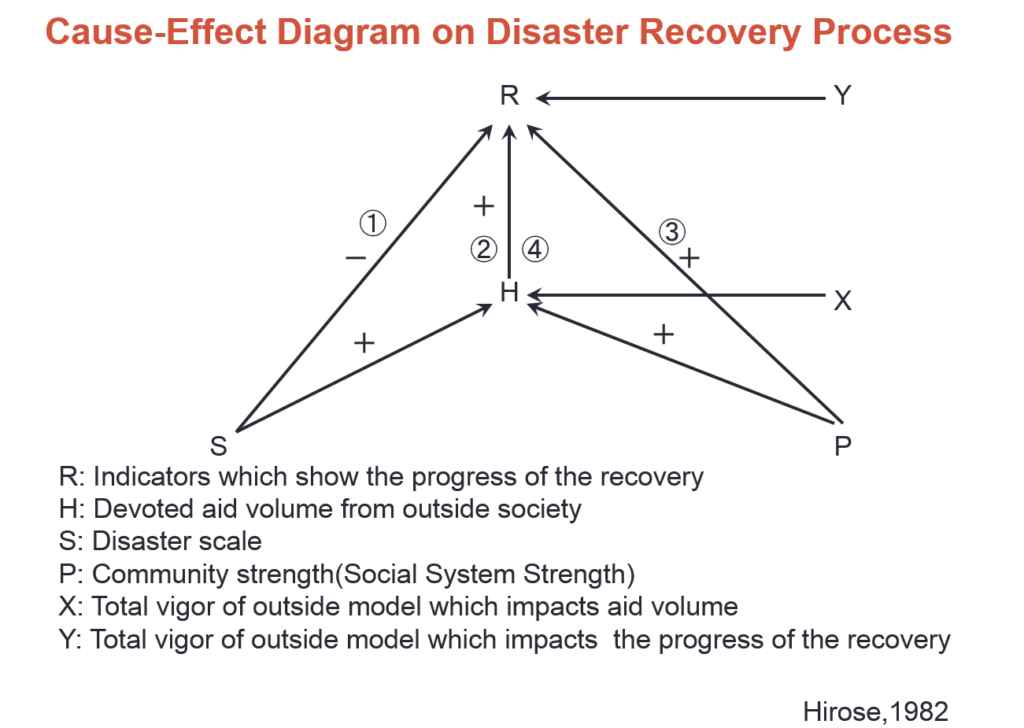
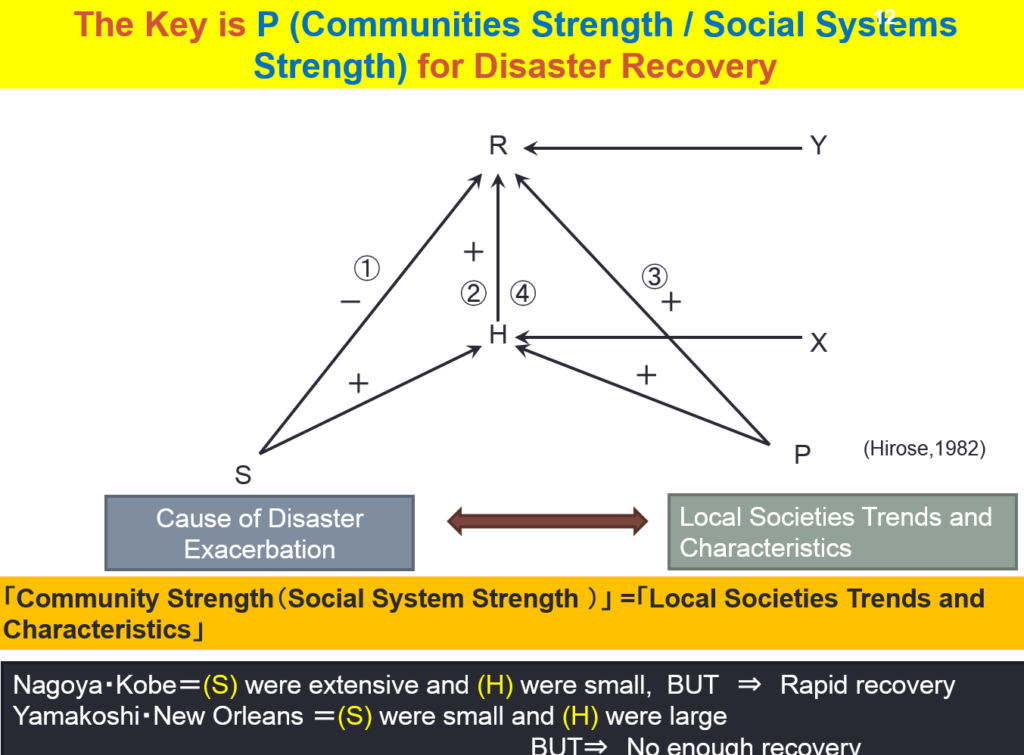
2) Theoretical framework 2
The disaster Process is influenced by
① Devoted aid volume from outside society
② Disaster scale
Community Strength (Social System Strength) (Hirose, 1982)
The first theory is confirmed by some cases. You can see the following figures: the Kanto earthquake, Fukui earthquake, Typhoon Isewan in Japan, and Hurricane Katrina in US.
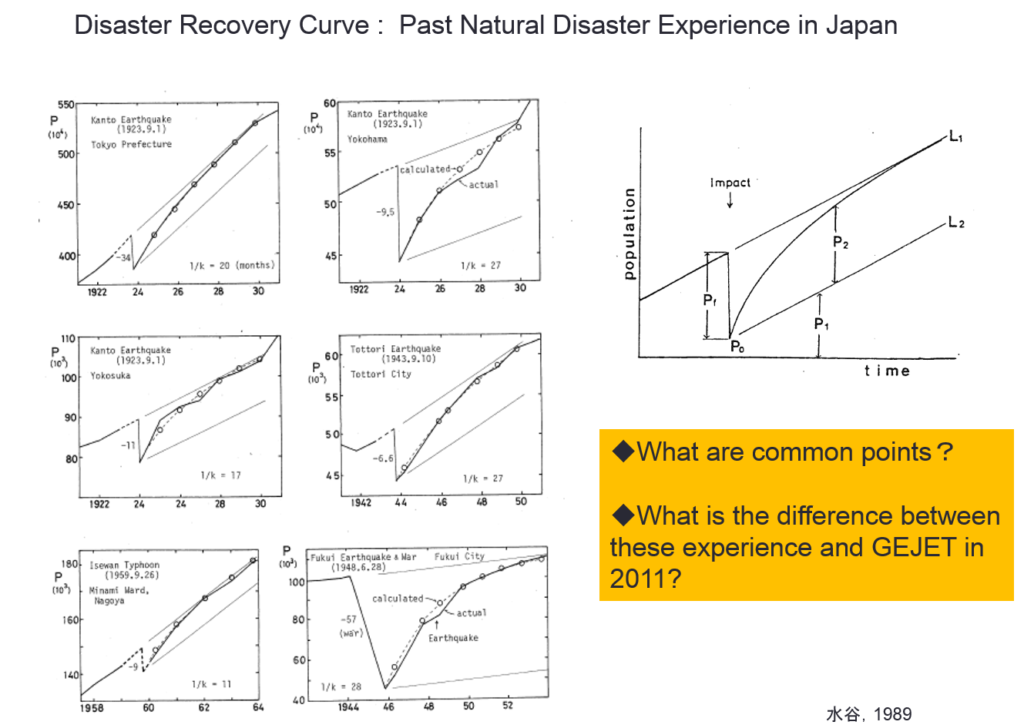
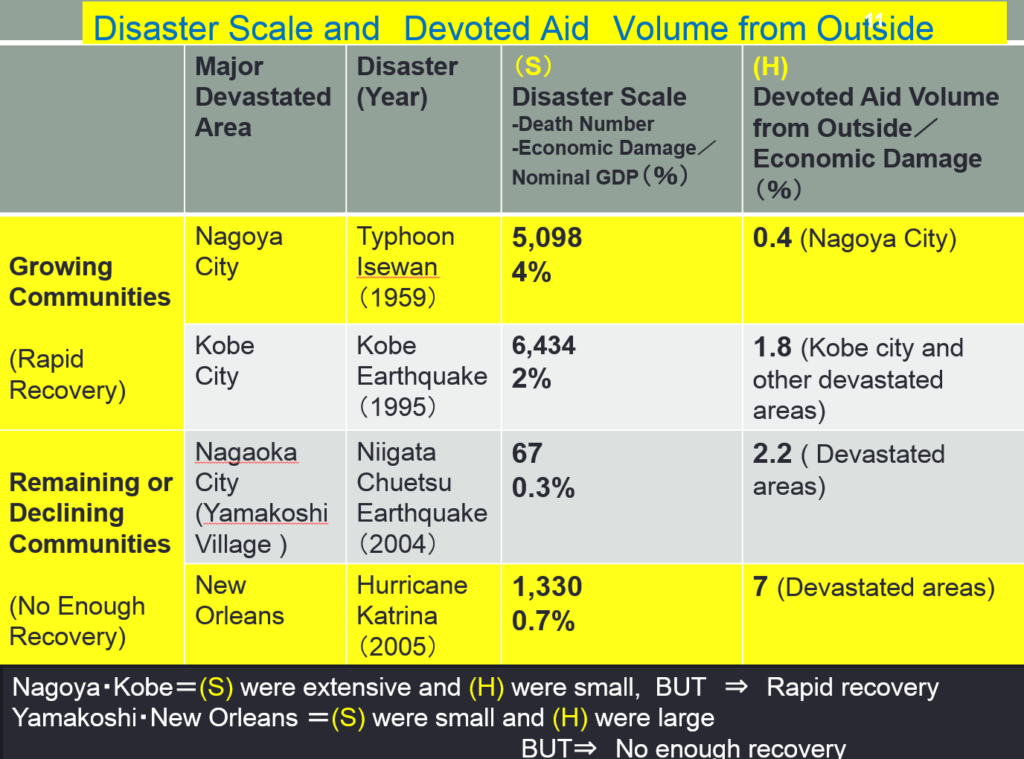
Figure 2: Disaster Recoveries in Japan
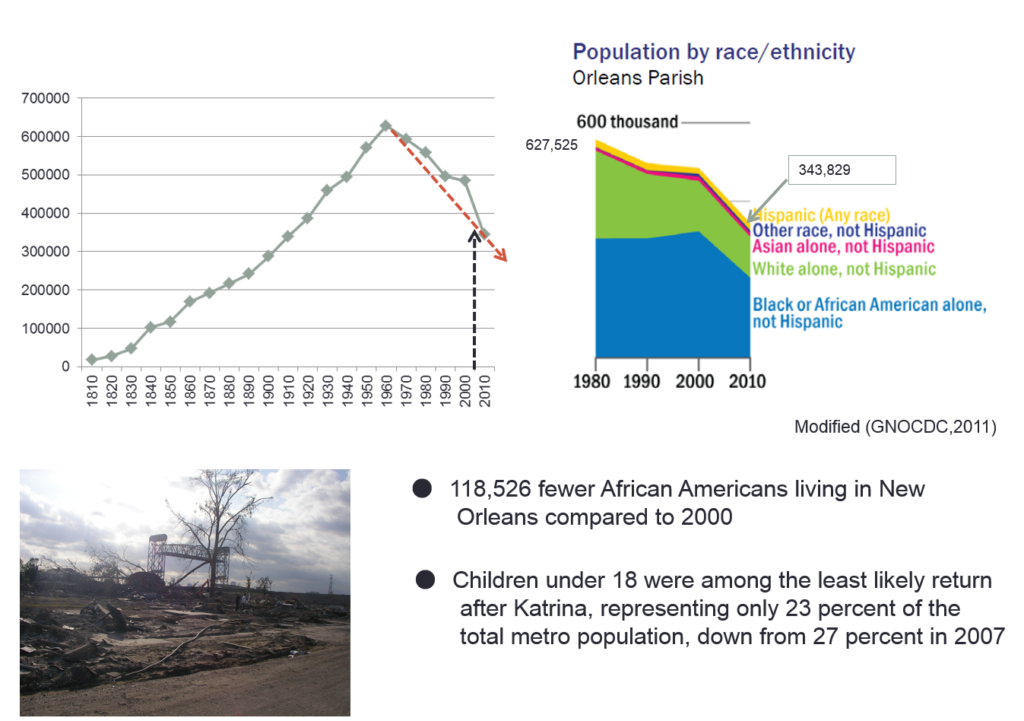
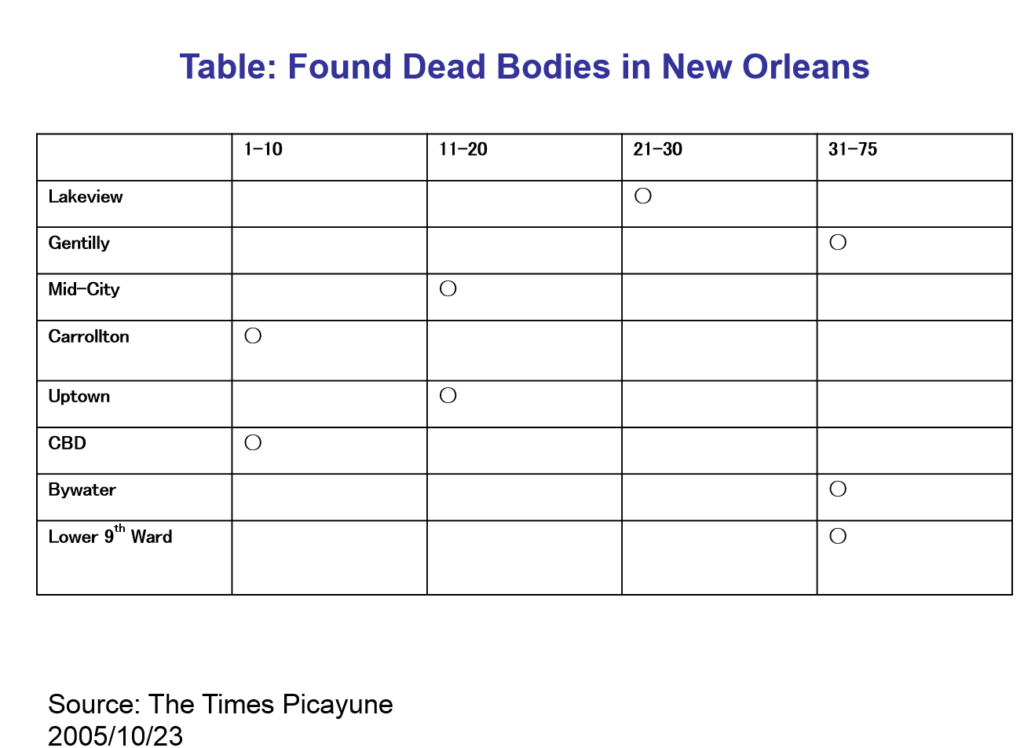
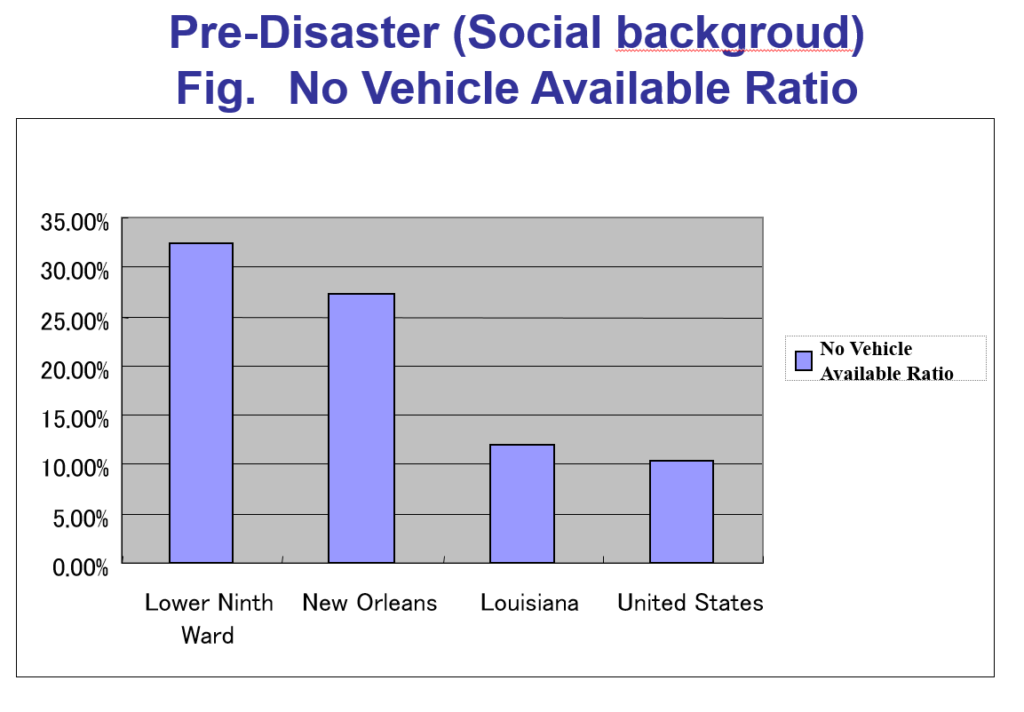
Figure 3: The Disaster Recovery from Hurricane Katrina in US.
To be continued…
This is the presentation summary. The presentation was made in 2011, after the tsunami in Japan.


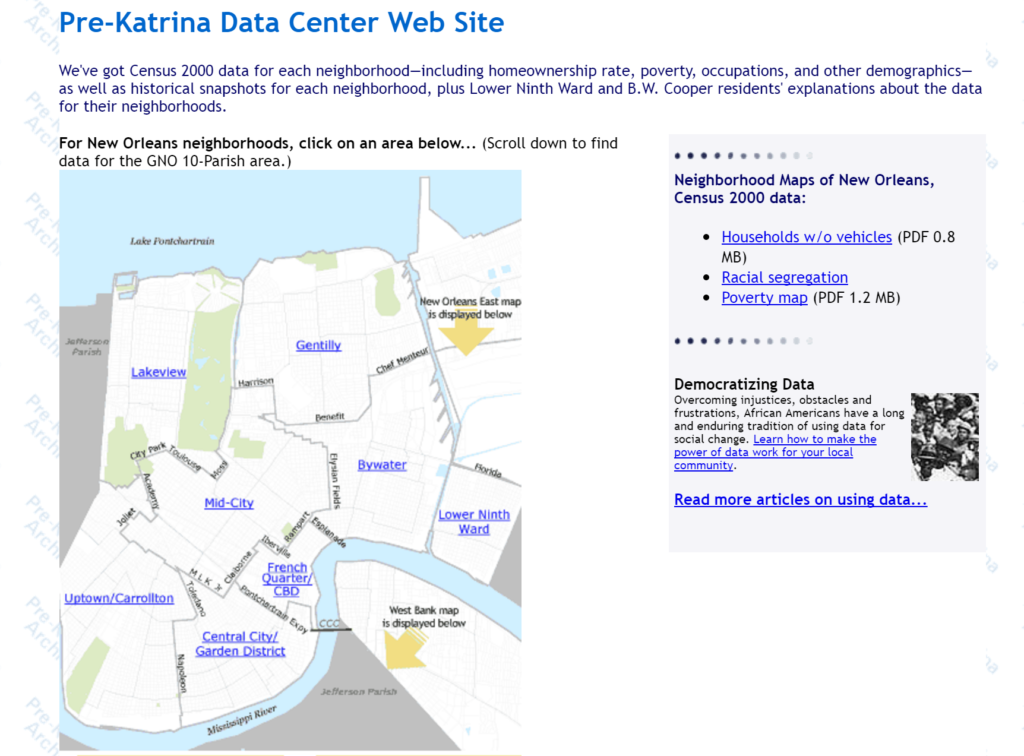 Figure 1 GNOCDC (Pre-Katrina data site)