Hurricane」カテゴリーアーカイブ

Day_207 : Lessons from Hurricane Katrina: A Retrospective Analysis and Future Implications for Disaster Risk Reduction


The picture was taken in Mississippi on December 3, 2005.

Nearly two decades have passed since Hurricane Katrina devastated the Gulf Coast, particularly New Orleans, in 2005. As we reflect on this catastrophic event, it’s crucial to reassess our understanding of the disaster, its impacts, and the lessons learned for future disaster risk reduction efforts. This updated analysis incorporates new research, recent case studies, and current best practices in disaster management to provide a comprehensive view of Hurricane Katrina’s long-lasting effects and implications for disaster preparedness.

Revisiting the Data: The Importance of Pre-Disaster Information

One of the most valuable resources for understanding the pre-Katrina landscape was the Greater New Orleans Community Data Center (GNOCDC) website. This data repository provided detailed demographic and socioeconomic information at the parish and ward levels, offering crucial insights into the social fabric of affected areas.

Key Findings from Pre-Katrina Data

  1. Vehicle Ownership: Data from GNOCDC revealed significant disparities in vehicle ownership across New Orleans neighborhoods. For instance, the Lower 9th Ward, one of the most severely affected areas, had a low rate of vehicle ownership. This factor critically impaired residents’ ability to evacuate independently, necessitating government assistance for evacuation.
  2. Socioeconomic Disparities: Analysis of household incomes, education levels, and employment rates across different wards highlighted pre-existing vulnerabilities that exacerbated the disaster’s impact.
  3. Housing Quality: Information on housing stock age and quality provided insights into structural vulnerabilities that contributed to the extent of physical damage.

The Victimization Process: A Multi-Stage Analysis

Understanding the disaster’s impact requires examining multiple stages of the event and its aftermath. Building on the original five-stage model (Pre-disaster, Direct Damage, Social Disorder, Life Environment, and Reconstruction and Recovery), recent research has emphasized the interconnectedness of these stages and their long-term implications.

Updated Insights on Disaster Stages

  1. Pre-disaster Stage:
    • New research highlights the critical role of community-based preparedness programs in enhancing resilience.
    • Studies show that areas with strong social networks and community engagement had better evacuation rates and post-disaster recovery.
  2. Direct Damage Stage:
    • Advanced modeling techniques have improved our understanding of infrastructure vulnerabilities, particularly in flood-prone areas.
    • Recent case studies from hurricanes like Harvey (2017) and Ida (2021) provide comparative data on immediate impact patterns.
  3. Social Disorder Stage:
    • Long-term studies have revealed the persistent psychological impacts of displacement and community disruption.
    • New frameworks for maintaining social order during disasters emphasize the importance of clear communication and community leadership.
  4. Life Environment Stage:
    • Research on environmental health impacts has expanded, including studies on mold exposure and water contamination.
    • The concept of “build back better” has gained traction, influencing reconstruction efforts to enhance resilience.
  5. Reconstruction and Recovery Stage:
    • Long-term studies show uneven recovery patterns, with some neighborhoods thriving while others continue to struggle.
    • The role of federal, state, and local policies in shaping recovery outcomes has been extensively analyzed, offering lessons for future disaster recovery planning.

Emerging Trends in Disaster Risk Reduction

Since Hurricane Katrina, several key trends have emerged in the field of Disaster Risk Reduction:

  1. Climate Change Adaptation: There’s an increased focus on integrating climate change projections into disaster preparedness and urban planning.
  2. Community-Based Disaster Risk Management: Emphasizing local knowledge and community participation in disaster planning and response.
  3. Technological Advancements: Utilization of GIS, remote sensing, and AI for improved risk assessment and early warning systems.
  4. Social Vulnerability Mapping: More sophisticated tools for identifying and addressing vulnerabilities based on socioeconomic factors.
  5. Nature-Based Solutions: Growing emphasis on using natural ecosystems to mitigate disaster risks, such as wetland restoration for flood control.

Actionable Recommendations

Based on lessons learned from Katrina and subsequent disasters, here are key recommendations for enhancing disaster resilience:

  1. Invest in Inclusive Preparedness: Ensure evacuation plans and resources are accessible to all community members, especially those with limited mobility or resources.
  2. Strengthen Infrastructure Resilience: Implement stricter building codes and invest in critical infrastructure upgrades, particularly in vulnerable areas.
  3. Enhance Early Warning Systems: Develop multi-channel, culturally appropriate warning systems that reach all segments of the population.
  4. Foster Community Cohesion: Support programs that build social capital and community networks, which are crucial for both evacuation and recovery.
  5. Integrate Social Vulnerability in Planning: Use social vulnerability indices to inform resource allocation and targeted support in disaster planning and response.
  6. Promote Sustainable Recovery: Implement recovery strategies that not only rebuild but also address pre-existing social and environmental issues.
  7. Continuous Learning and Adaptation: Establish mechanisms for ongoing assessment and incorporation of lessons learned from each disaster event.

The tragedy of Hurricane Katrina continues to offer valuable lessons for disaster risk reduction. By combining data-driven analysis with a nuanced understanding of social and environmental factors, we can work towards creating more resilient communities. As we face increasing challenges from climate change and urban growth, the insights gained from studying Katrina’s impact remain crucial for shaping effective disaster management strategies worldwide.

Hurricane Katrina Disaster Research conducted by NIED(in Japanese)

A comparative analysis of large-scale flood disasters

Day_192 : What are the differences between cyclones, typhoons, and hurricanes?

The terms cyclone, typhoon, and hurricane all refer to the same meteorological phenomenon but are used in different regions of the world. They describe a large, violent tropical storm system with strong winds and heavy rain. Here are the distinctions:

  1. Cyclone is the term used in the South Pacific and Indian Oceans. The word “cyclone” is also used in a broader sense to refer to any circulating weather system over the ocean characterized by closed isobar patterns and circular wind movement, whether tropical or not. In the Indian Ocean and South Pacific, when the system reaches sustained wind speeds of at least 74 miles per hour, it is called a tropical cyclone.
  2. Typhoon is the name given to these storm systems in the Northwest Pacific Ocean, typically west of the dateline. Like hurricanes and cyclones, a typhoon forms over warm tropical oceans and gains energy. When the sustained winds in this system reach or exceed 74 miles per hour, it is officially referred to as a typhoon.
  3. Hurricane is the term used in the North Atlantic, Central, and Eastern North Pacific oceans. The criteria for being classified as a hurricane are the same as for typhoons and cyclones, with sustained wind speeds of at least 74 miles per hour.

The naming convention is primarily geographical. The structure and behavior of these storms are the same, and they all belong to the category of tropical cyclones. The difference in nomenclature does not imply a difference in the hazard or potential damage these storms can cause, which is primarily dependent on their size, strength, and the area they affect.

A condensed list of references to support the distinctions between cyclones, typhoons, and hurricanes:

  1. The World Meteorological Organization (WMO) provides official definitions and classifications for tropical cyclones, typhoons, and hurricanes based on regional basins.
  2. National Hurricane Center (NHC) and Central Pacific Hurricane Center (CPHC): Part of the United States’ National Oceanic and Atmospheric Administration (NOAA), these centers offer detailed information on hurricanes, including the distinctions between hurricanes, typhoons, and cyclones.
  3. The Australian Bureau of Meteorology (BOM) offers insights into cyclones, especially in the South Pacific and Indian Ocean regions, detailing their formation, classification, and impacts.
  4. Japan Meteorological Agency (JMA): Provides information on typhoons, their tracking, and impacts in the Northwest Pacific region.
  5. Indian Meteorological Department (IMD): Offers comprehensive data on cyclones in the Indian Ocean, including classifications and warnings.

These organizations are key in tracking, studying, and providing information on these storm systems worldwide. They use specific criteria for wind speeds, atmospheric pressure, and other factors to classify these storms according to the region they occur in.

Day_166: Interview Report: Hurricane Katrina Response (3)

>>>>>>>>>>>>>>>>>>>>>>>>>>>>
Date and time
7 May 2006

Visit
New Orleans Homeland Security and Public Safety Office
(New Orleans City Office of Homeland Security and Public Safety )

Interviewee
Colonel and Director

Subject
Hurricane Katrina Disaster Response
>>>>>>>>>>>>>>>>>>>>>>>>>>>>>>>

https://disasterresearchnotes.site/archives/3002

There are three drainage canals in New Orleans. There is also a pump station for each. Since New Orleans is below sea level, water is constantly pumped from these pump stations and drained into Lake Pontchartrain.

The breakwater was corrupted by the storm surge. The water was flowing into the canal from the lake, and at the same time, the pump station had the maximum pressure with the water. The pumps were broken and became not-functioned.

After the hurricane, there was only one evacuation route that crossed the bridge over Mississippi. However, the route had been blocked. These also affected support activities.

<Measures for breakwater>
At present, the Corps of Engineers will set a lock at the entrance of the canal and close them to prevent water from flowing into the canal since this year.

The challenge from this year is the evacuation of West Bank citizens. Because the levees are weak, hurricanes can easily break them.

The levee can be effective this year, but the problem is that in the next two years, the pump station will have insufficient capacity to pump water.

< Future measures of the city >
The following three goals are set as future measures. First, leave no one in the shelter. Second, the city will assist those who have no access to evacuation. Third, improve the safety of city facilities and property before and after the disaster.

Another important point this year is to let all citizens evacuate two days before Hurricane hit. The challenge is the reality that many people would not try to evacuate. As a background, the levee is to be broken, needs to have a terrible situation imagination.

There is a plan to install floodgates in a wide range of wetlands in eastern New Orleans to prevent storm surges.

Political challenge, New Orleans, including the peripheral has originally 100 million people, was an energy supply base, there is a tremendous national influence, the people here have to work.

As a countermeasure, the city has provided a wireless system. The system had been unavailable after the Hurricane.

A radio station in City Hall as a countermeasure against rumors which had become a social issue during Katrina was set up to keep media members staying and unifying the correct information.

Related information

The NIED team went to New Orleans and Missippi coastal areas to investigate.
Characteristics of the 2005 Hurricane Katrina Disasters

The community data center is the best to investigate to grasp the trend by using stats.

https://disasterresearchnotes.site/archives/2975

Day_161: Interview Report: Hurricane Katrina Response (2)

>>>>>>>>>>>>>>>>>>>>>>>>>>>>>>>>>
Date and time
7 May 2006
Visit
New Orleans Homeland Security and Public Safety Office
(New Orleans City Office of Homeland Security and Public Safety )

Interviewee
Colonel and Director

Subject
Hurricane Katrina Disaster Response

>>>>>>>>>>>>>>>>>>>>>>>>>>>>>>

https://disasterresearchnotes.site/archives/4059

<Contents>

The following situations were going on to make a decision; one is for the residents who have no means to evacuate and do not have the supply transportation means from the city. The other is for the people who have the means to evacuate but do not do that.

Under these circumstances, a federal rescue bus arrived six days later.

The city ​​has been flooded for two days since the water entered New Orleans. Specifically, the city hall had no water shortly after passing the hurricane, but two days later, it was almost breast-high water level inundation.


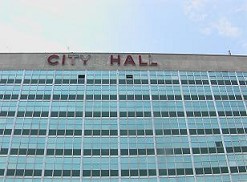
Picture: New Orleans City Hall (7 May 2006)

<Current Social Situation>

New Orleans was the only city in the United States to lose its school system, the justice system, home, and tax system. This week, the first trial has been held since last August.

In terms of the school system, only 4 out of 140 schools are open.

The water supply system has lost 80 %.

There is a nuclear power plant near New Orleans. Entergy Corporation is the operating company. However, the company was bankrupted. There are only 10 out of 400 staff members at present.

The natural gas pipeline has been damaged, making gas supply impossible. There are these energy supply problems.

As mentioned, the Entergy Corporation, which is supplying the gas, has been bankrupted, the Entergy Corporation has no support measures from the government.

<New Orleans Society and Geographical Background>

Hurricane Katrina is a human-made disaster. Concerning the background, levees were built in the early 1800s and have worked to prevent annual floods. However, the wetlands had been overlooked. In this area, they dug up the route, so this may cause the storm surge, and also oil drilling reduces the wetlands, weakened resistance to hurricanes.

Katrina disaster is also a national issue. The background of southeastern Louisiana, 40 % of the country’s oil is supplied from here. At the same time, 60 percent natural gas supply of the country is from here. Also, it has 135 chemical and petroleum refineries along the Mississippi River. These are unlikely to create a similar zone in the United States, where environmental pollution becomes a social problem. The Port of New Orleans (New Orleans harbor) can have the giant scale oil tanker in the port. Moreover, the New Orleans area is also a freight rail hub.

To be continued…

Day_160: Interview Report: Hurricane Katrina Response (1)

Now I am digging up my past experience. The report is a part of the project.

The below past article can be checked for your reference.

https://disasterresearchnotes.site/archives/2975

>>>>>>>>>>>>>>>>>>>>>>>>>>>>>>>>>>>>>>>>>>>>>>>>>>>

Date and time
7 May 2006

Visit
New Orleans Homeland Security and Public Safety Office
(New Orleans City Office of Homeland Security and Public Safety )

Interviewee
Colonel and Director

Subject
Hurricane Katrina Disaster Response

>>>>>>>>>>>>>>>>>>>>>>>>>>>>>>>>>>>>>>>>>>>>>>>>>>

<Contents>
< Work >
The interviewee: Responsible for the Police, fire, EMS (emergency medical services),
and crisis management of cooperation with state, federal and city

< The lessons of Katrina >
The lesson learned is, “We can not rely on external resources. Without relying on the federal (country) government, each person should think they need to protect themselves.” (This is the interview record.)

<Hurricane Katrina-What Happened>
Before Friday (8/26), all the state government was setting evacuation preparation. FEMA staff deployed throughout the city. Eighty percent of citizens evacuated on their own, but many of the rest were unable to evacuate with no means.

The city, about 15,000 civilians, were provided transportation means to be saved in the shelter. Besides, before hurricane landfall on Sunday(8/28), the people in the city who can not evacuate evacuated to Super Dome.

Since the federal government does not permit having a shelter in New Orleans, New Orleans is the only city ​​in the U.S. that does not have a shelter. The Federation and the Red Cross had considered the situation as a dangerous task because of this.

When the hurricane comes, Super Dome became a temporary shelter.

Picture: New Orleans City Hall (on 7 May 2006)

After the hurricane, we had a tough week. After all, approximately 700 people of citizens lost their lives.

Day_103 : New Orleans and Hurricane Katrina in 2005

Day_100 indicated a human suffering exacerbation process in New Orleans during the 2005 Hurricane Katrina.

http://disasters.weblike.jp/disasters/archives/2975

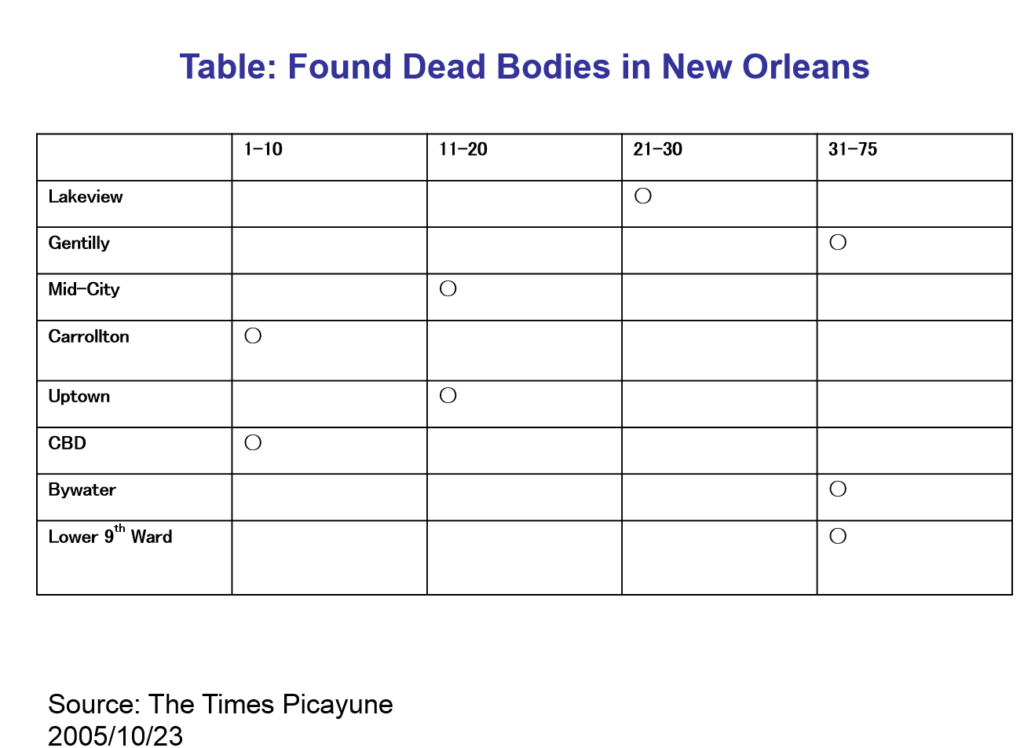
The Figure 1 again shows the relationships between the human suffering exacerbation process and social backgrounds with data. Table 1 also indicates the estimated death numbers in some wards.

exacerbation2
Figure 1 Human Suffering Exacerbation Process and Social Background

Table 1 Found Dead Bodies in New Orleans

dead in neworleans

The total views are indicated in the following Figure 2, 3, 4, and Table 2.
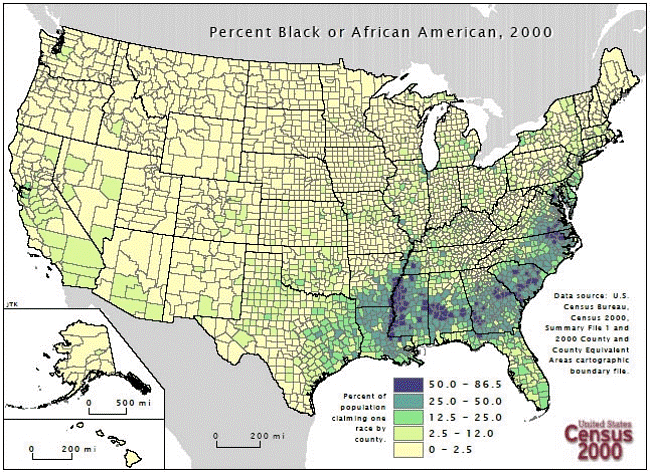
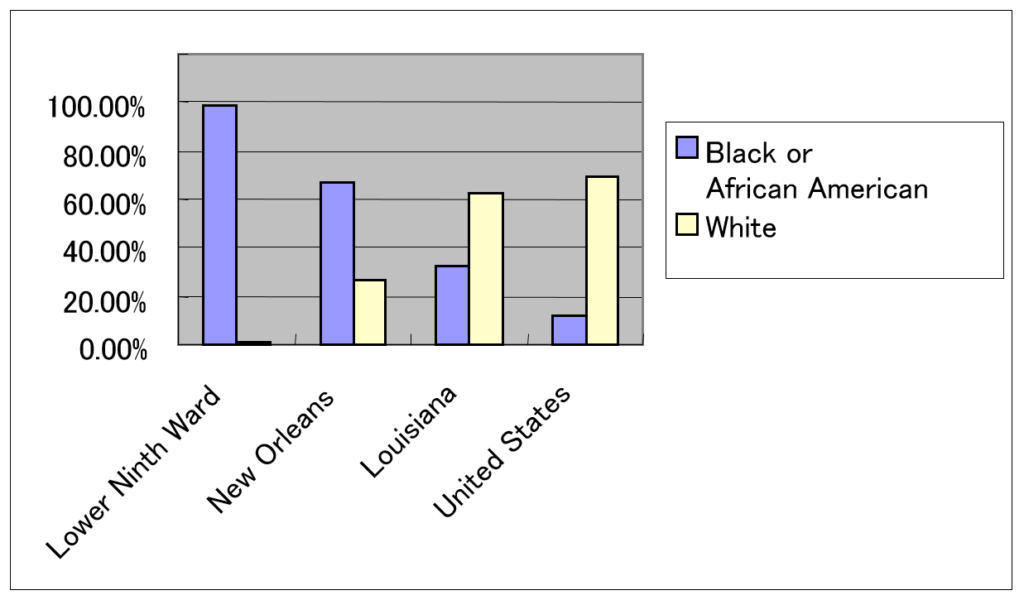
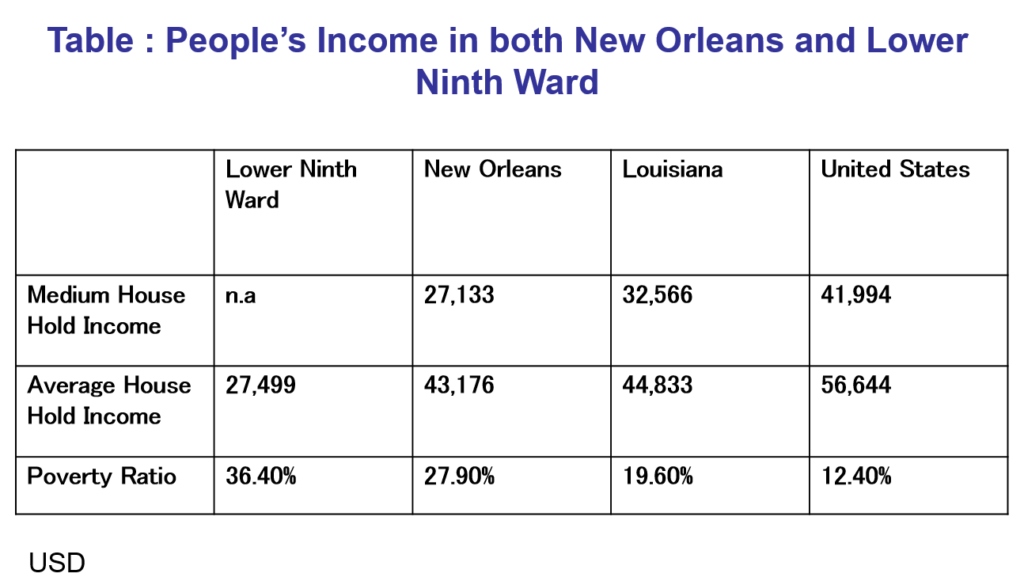
Concerning the population change, New Orleans is the one of the decreasing communities in US. For example, rapid urbanization related matters caused environmental degradation before the disaster. Campanella(2004)mentioned New Orleans became not a sustainable, but a survival city. The lower 9th ward, for example, with regard to the ethnicity, we can see the high black and the African American proportion.  With respect to Income, we can also identify the people living in the Lower 9th ward have lower incomes.

NOLApopulation
Figure 2  Population Change Louisiana( Light Blue ) and New Orleans (Dark Blue)


2000census
Figure 3 Percent Black or African American, 2000 (Census, 2000)

pop and ethnicities
Figure 4 Percent Black or African American and White
(Source: Congressional Research Service)

Table 2 People’s Income in both New Orleans and Lower 9th Ward

income katrina

These are referred by an NIED publication.

Day_100 : A Human Suffering Exacerbation-Data from Greater New Orleans Community Data Center

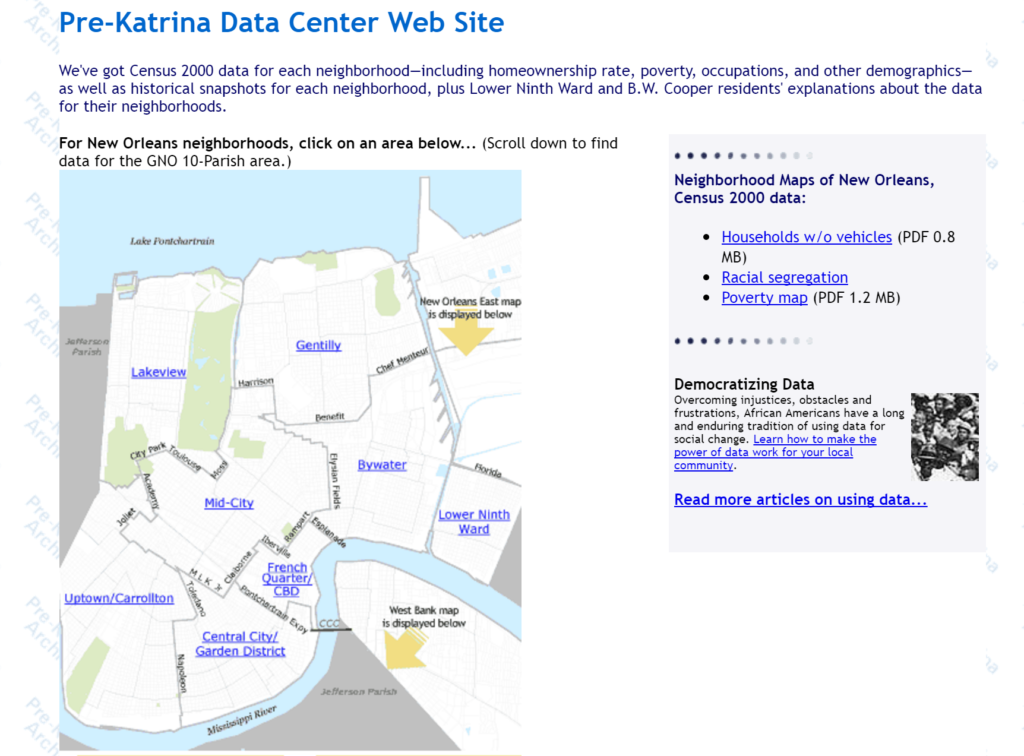
The Greater New Orleans Community Data Center (GNOCDC) website was found after the field survey on Hurricane Katrina in Louisiana and Mississippi in 2005. I was so amazed. This is the one of the demographers great contributions to disaster research.

The site provides the information of the pre-Katrina situations by parish and also by ward. This is very useful to examine the social backgrounds of the areas in detail.

gnocdcPrekatrinaFigure 1 GNOCDC (Pre-Katrina data site)
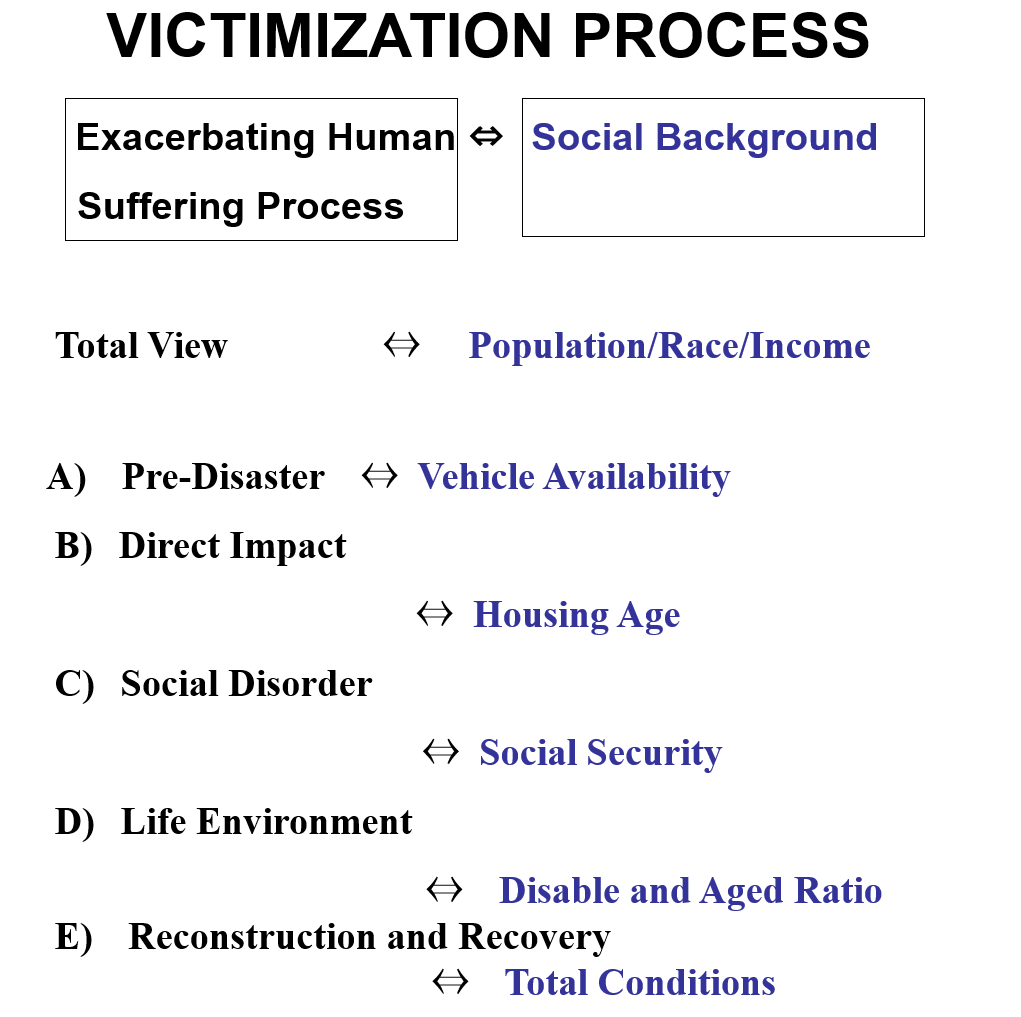
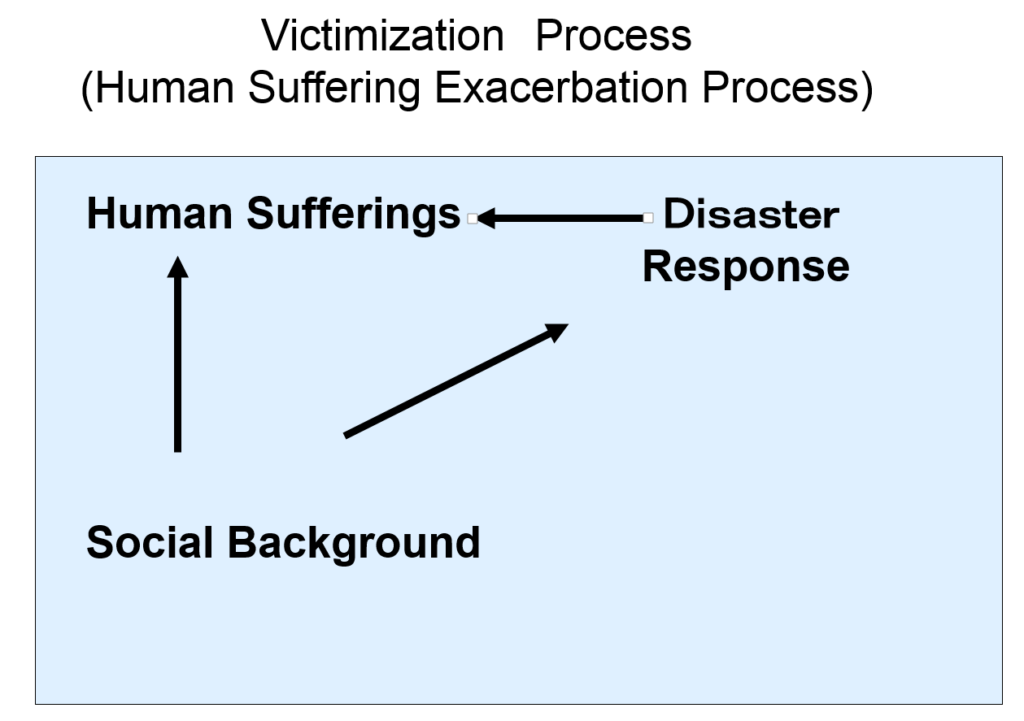
The paper on Karina disaster using these data is to explain how human sufferings were exacerbated by the stage with the social background as shown in Figure 2 (Nakasu, 2006 :Sorry in Japanese, however, summary and figures are in English).

human suffering
Figure 2 Victimization Process

exacerbation2
Figure 3
Victimization Process by Stage

Table 1 Found Dead Bodies in New Orleans  

dead in neworleans

The process can be divided into five stages with time such as A) Pre-disaster B) Direct damage C) Social disorder D) Life environment  E) Reconstruction and recovery. Then, these are examined with the social background data (Figure 3).

For example,  1) Pre-disaster stage, I picked up an evacuation aspect to explain the social background of this stage.

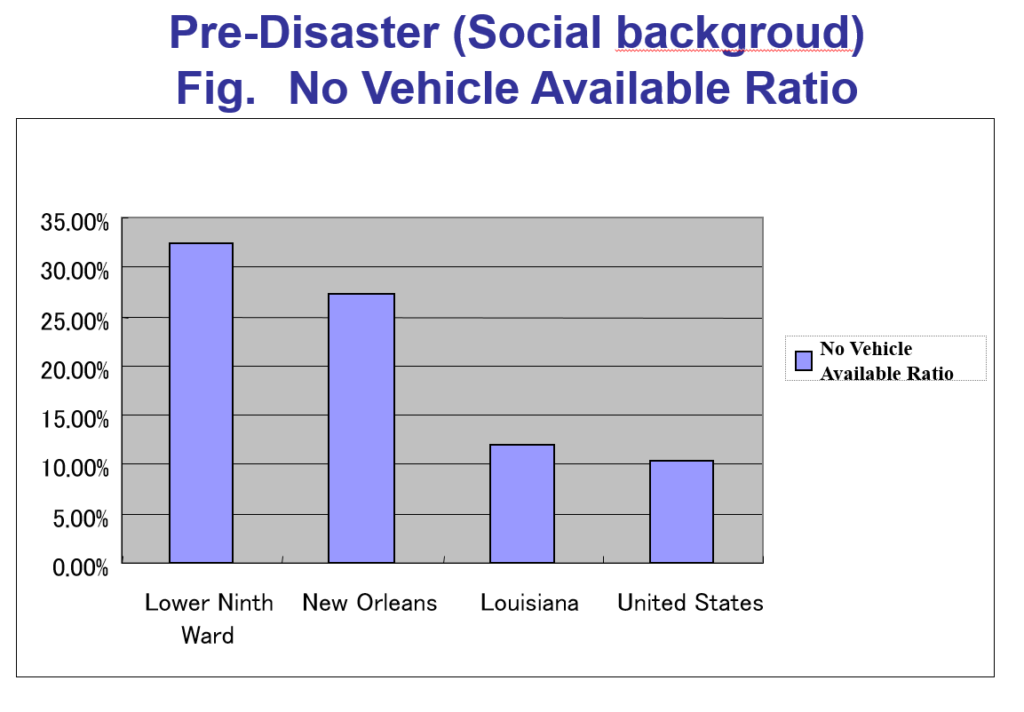
Using the GNOCDC database, I could check the possession ratio of the vehicle in some areas.

novehicle
Figure 4 No Vehicle Available Ratio (GNOCDC)

Table 1 and Figure 4 show the people in Lower 9th ward, one of the most severely affected areas, had a low possession ratio of the vehicle. This can explain so many residents needed to have government help to evacuate and they could not evacuate before the Hurricane hit.

The general social background, such as ethnic groups, household incomes, and others with other stages of examinations will be discussed later.


The Great Deluge: Hurricane Katrina, New Orleans, and the Mississippi Gulf Coast (English Edition)

Day_77 : Historical trends of the damages caused by natural disasters

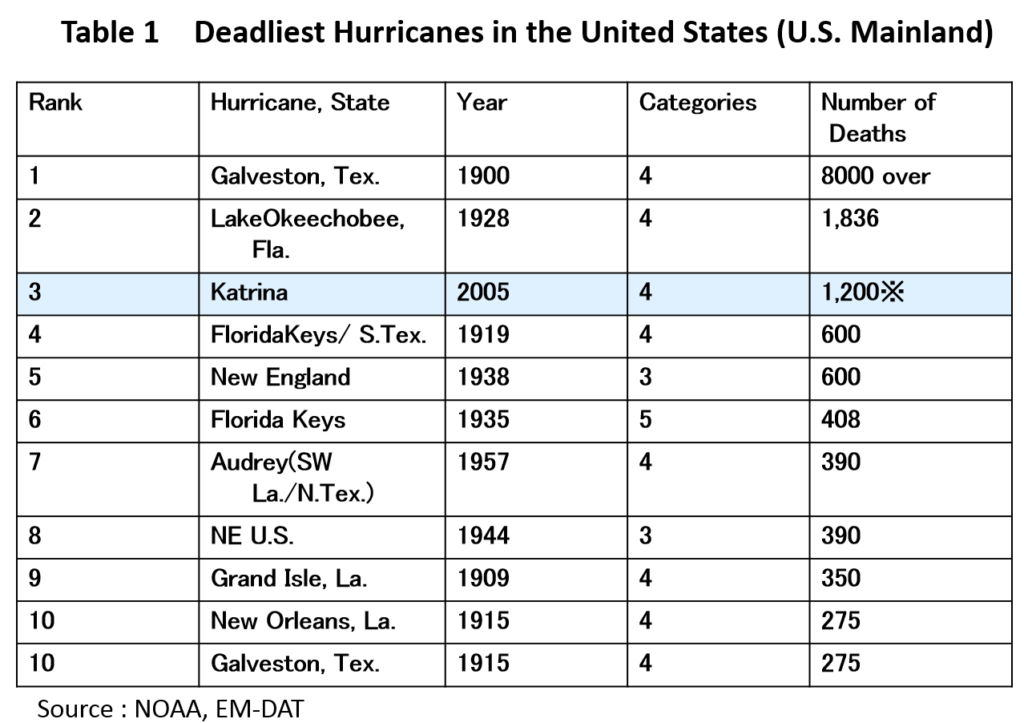
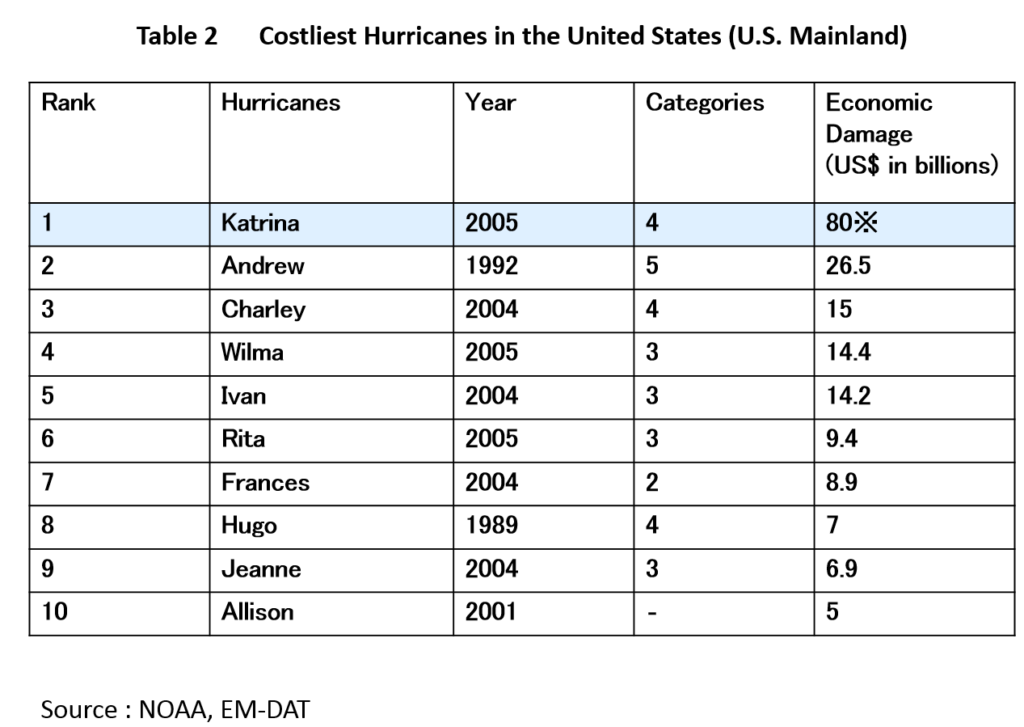
The damages caused by natural disasters are from human to economy with the development. This is one of the universal and historical trends in the world and within the countries. Mortality numbers of natural disasters tend to be decreasing with national development, but economic losses are the opposite. This is because of urbanization, science and technology advancement, asset values, and so on. This is the same as developing and developed countries’ relationships. Developing countries tend to have high mortality numbers, on the other hand, developed countries are inclined to have high economic losses.

The following tables (little bit old, sorry) which I used to research on Hurricane Katrina in 2005. What you can say about these?

table1

table2

Yes, table 1 indicates almost all high mortality numbers hurricane disasters in the United States are before 1960. On the contrary, table 2 shows almost all high-cost hurricane disasters are after 2000.

sponsored link

Day_16 : GNOCDC

The Greater New Orleans Community Data Center (GNOCDC) website was found after the field survey on Hurricane Katrina in Louisiana and Mississippi in 2005. I was so amazed. This is one of the demographer’s great contributions to disaster research.
The site has the following:
http://www.datacenterresearch.org/pre-katrina/prekatrinasite.html

The site provides information on pre-Katrina situations in a parish. This is very useful to examine the social backgrounds of the areas in detail.
I wrote the paper by using these data to explain how human suffering was exacerbated by social backgrounds (sorry in Japanese; however, the summary and figures are in English).
http://dil-opac.bosai.go.jp/publication/nied_natural_disaster/pdf/41/41-05.pdf