Day_100 indicated a human suffering exacerbation process in New Orleans during the 2005 Hurricane Katrina.
http://disasters.weblike.jp/disasters/archives/2975
The Figure 1 again shows the relationships between the human suffering exacerbation process and social backgrounds with data. Table 1 also indicates the estimated death numbers in some wards.
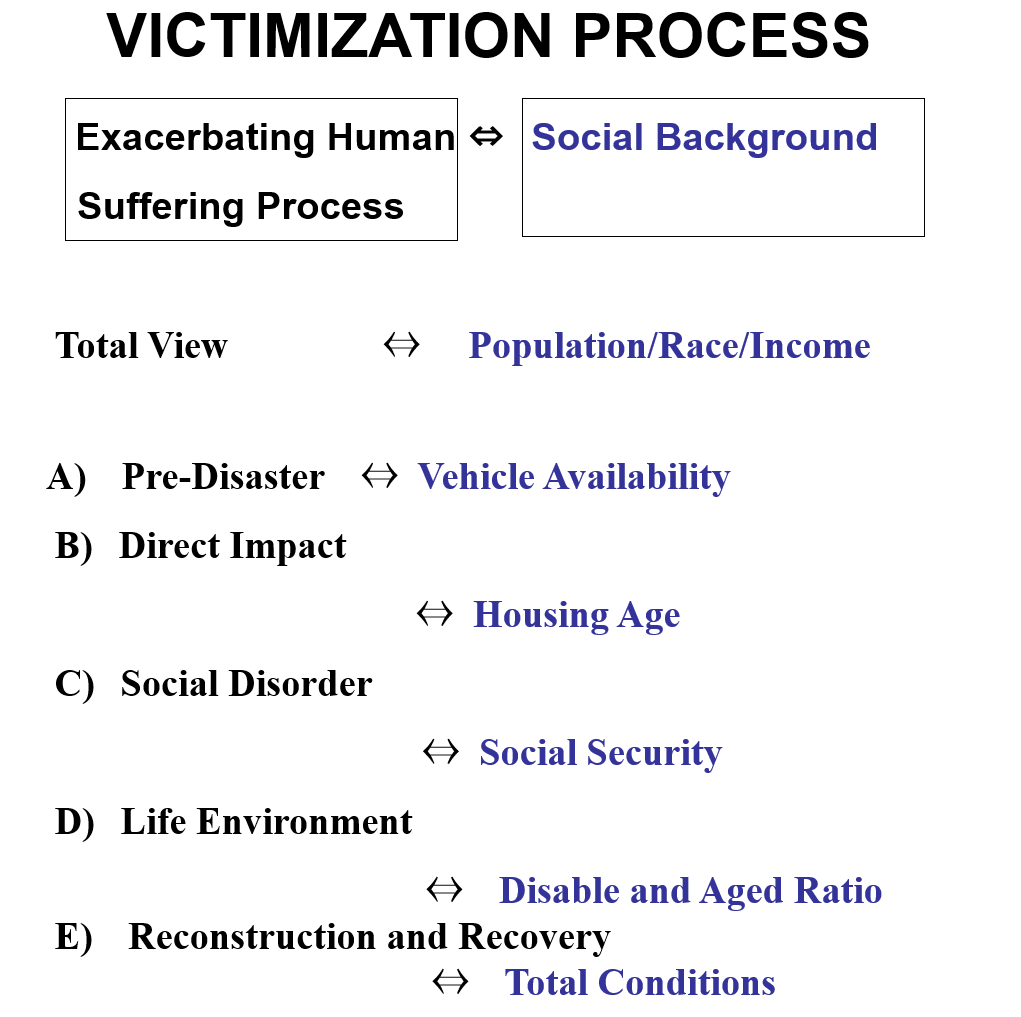
Figure 1 Human Suffering Exacerbation Process and Social Background
Table 1 Found Dead Bodies in New Orleans
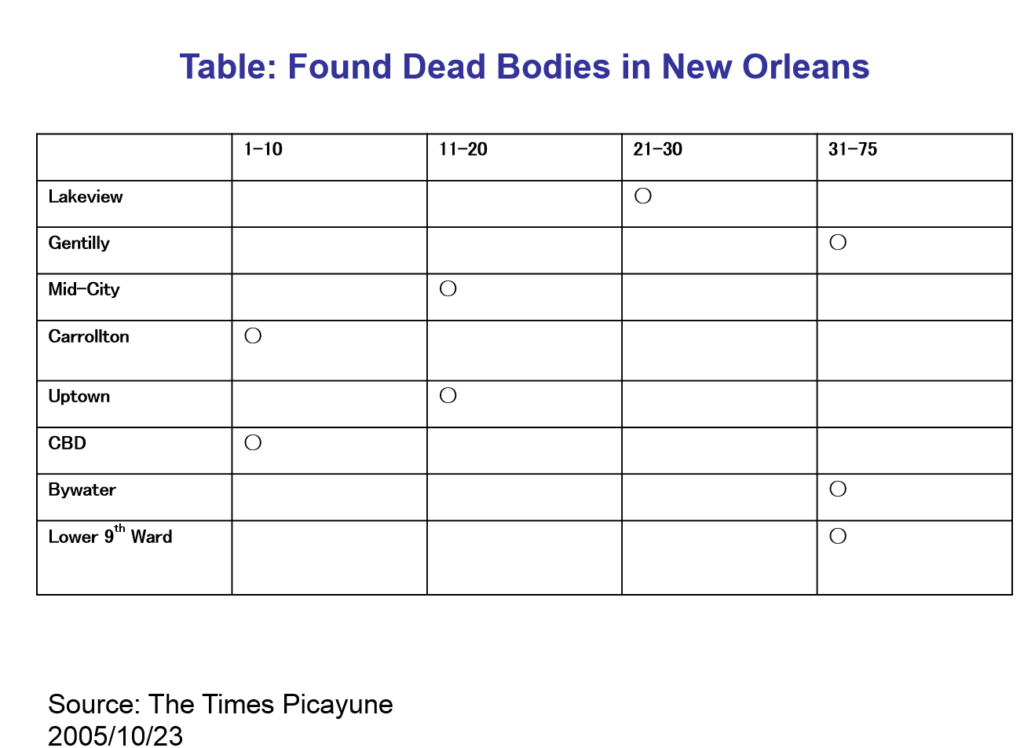
The total views are indicated in the following Figure 2, 3, 4, and Table 2.
Concerning the population change, New Orleans is the one of the decreasing communities in US. For example, rapid urbanization related matters caused environmental degradation before the disaster. Campanella(2004)mentioned New Orleans became not a sustainable, but a survival city. The lower 9th ward, for example, with regard to the ethnicity, we can see the high black and the African American proportion. With respect to Income, we can also identify the people living in the Lower 9th ward have lower incomes.
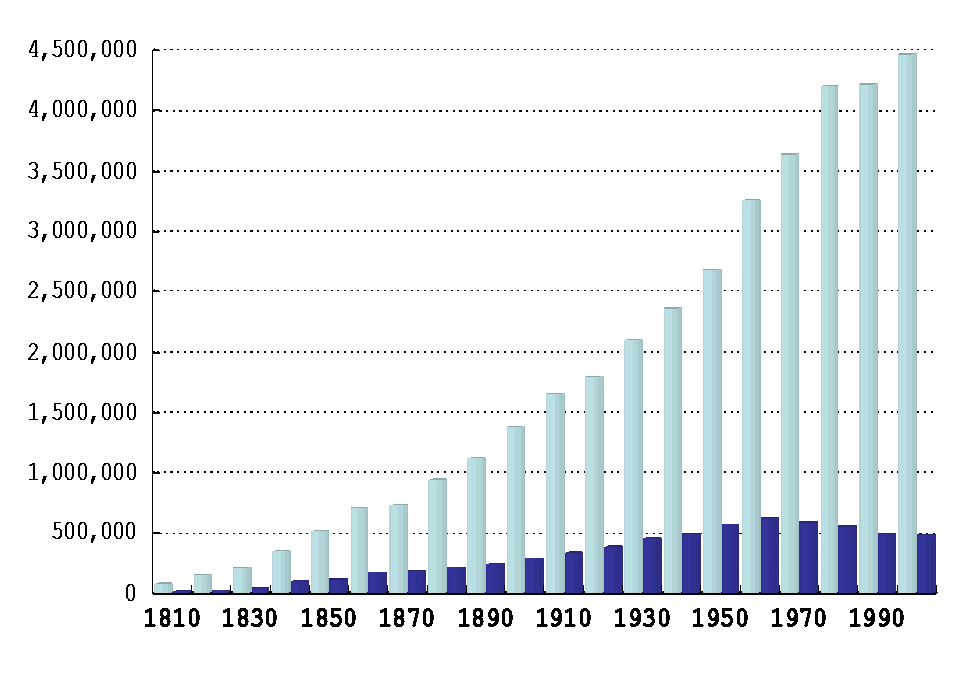
Figure 2 Population Change Louisiana( Light Blue ) and New Orleans (Dark Blue)
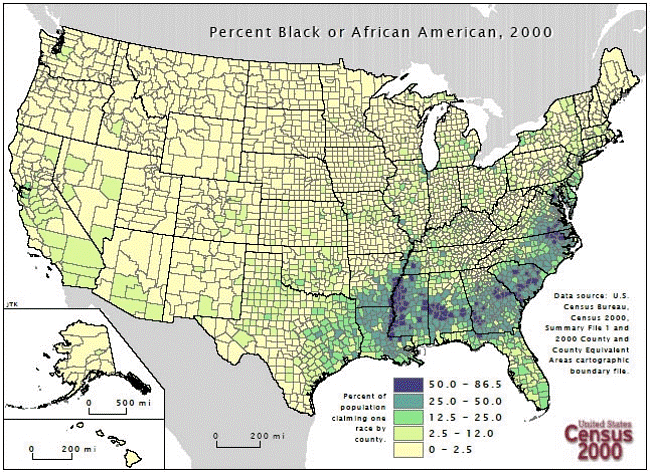
Figure 3 Percent Black or African American, 2000 (Census, 2000)
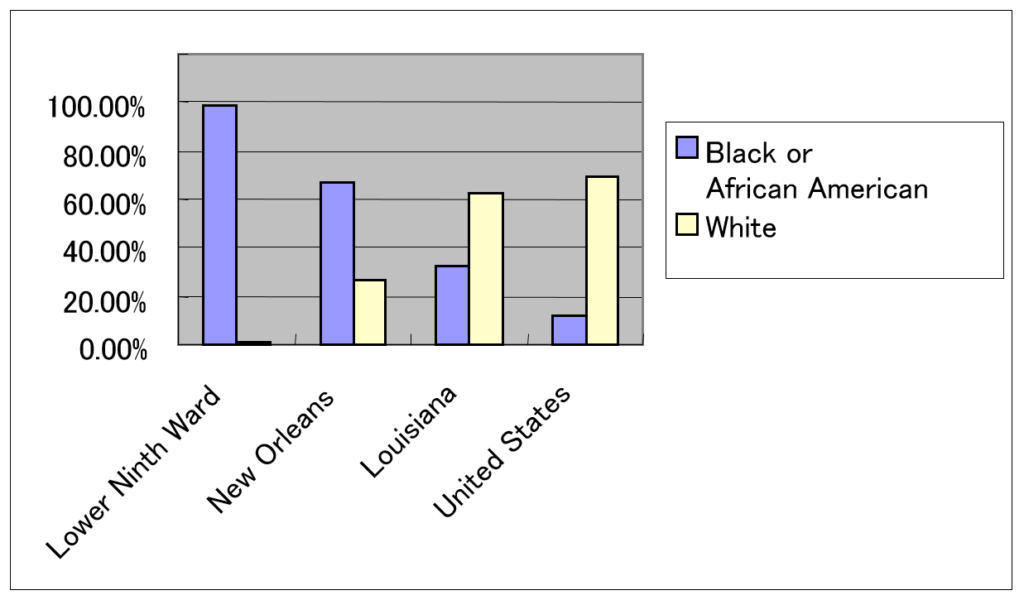
Figure 4 Percent Black or African American and White
(Source: Congressional Research Service)
Table 2 People’s Income in both New Orleans and Lower 9th Ward
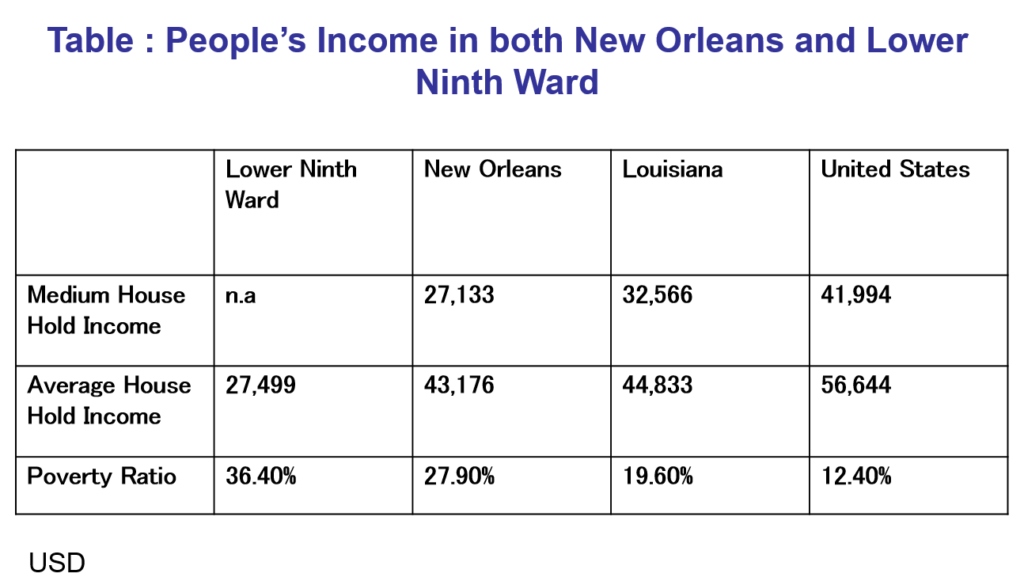
These are referred by an NIED publication.


