Asia」カテゴリーアーカイブ

Day_137 : Aging Asia to Natural Disasters -Thailand(2)-

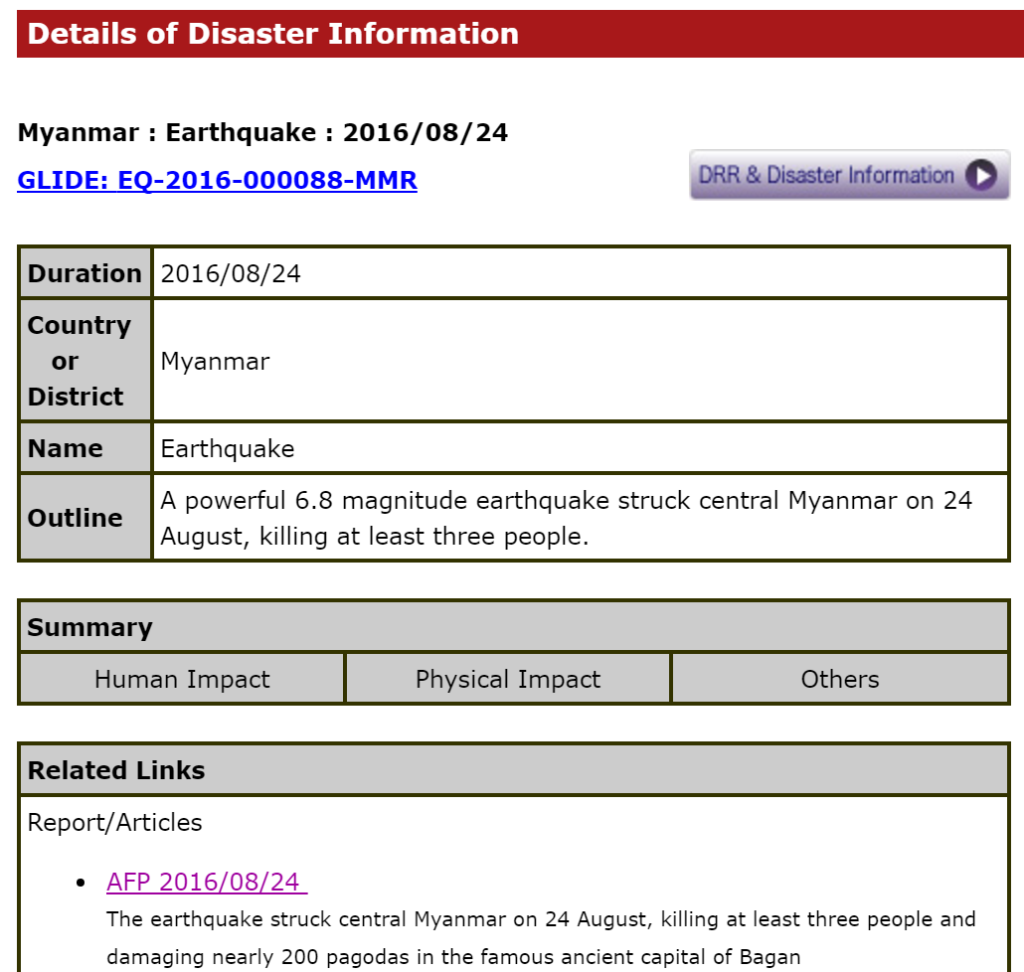
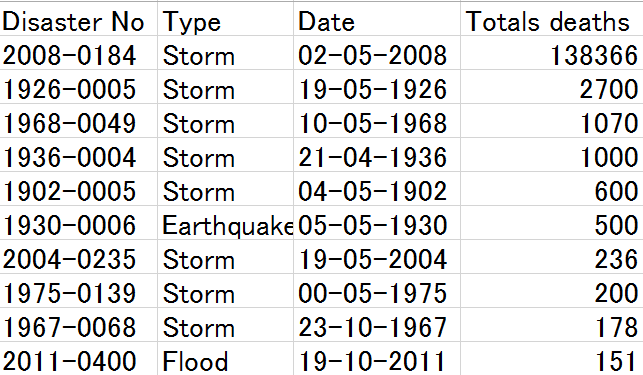
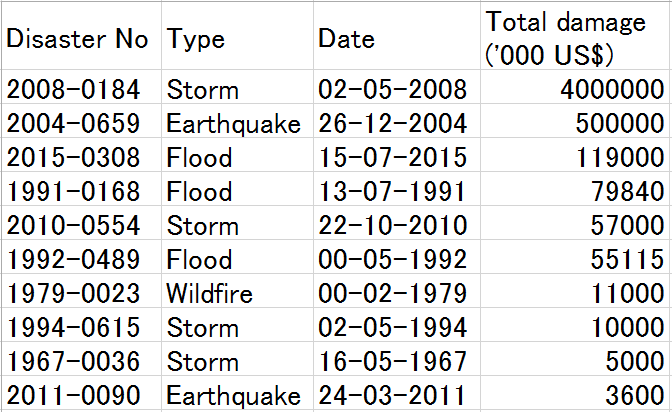
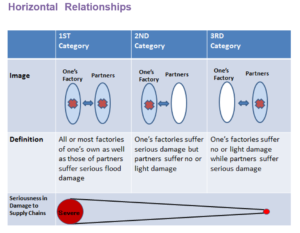
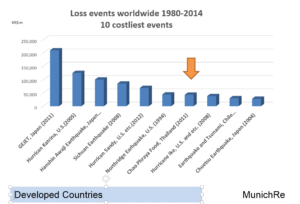
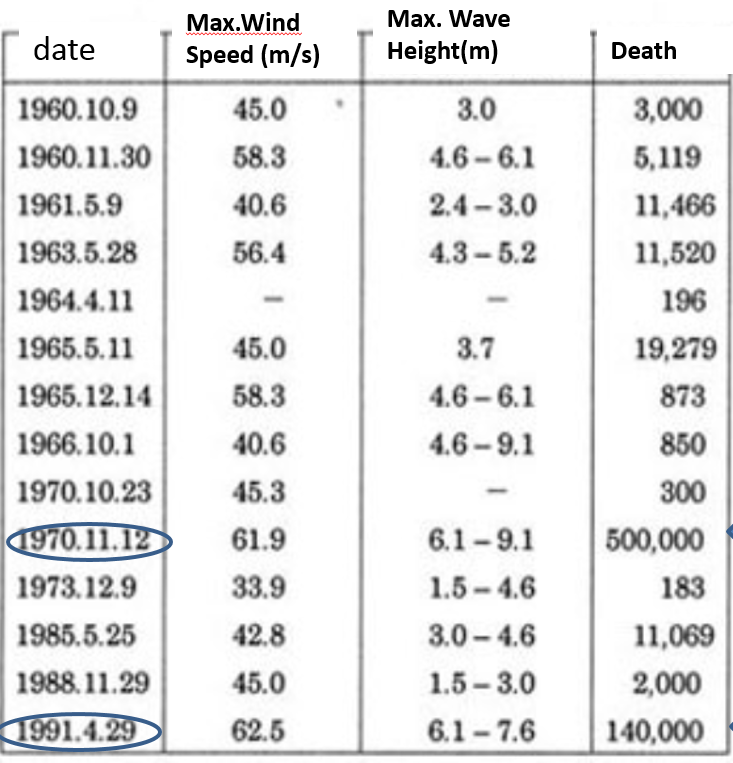
Day_68 indicates Thai population in 2012 was 64,460,000 and the proportion of those over 65 is 8.6 percent (11 percent in 2016) compared to 3.1 percent in 1970. This shows that Thailand is facing an aging society and the World Population Prospects* predicts this trend will accelerate. This situation is not exclusively in Thailand, but can likewise be viewed in almost all Asian nations. In addition, Asia is the most vulnerable in terms of natural disasters such as 7 of 10 of the deadliest natural disasters (1980-2014) took place in this region(Day_79). The World Bank mentions how Thailand faces the aging society from an economic development perspective, however, we also need to recognize this from a disaster reduction viewpoint. Okushiri island case can give us a significant insight(Day_75). This gives us a challenge of how disaster-resilient society can be established in the situation.

The World Bank notices**:
The Thai population is aging rapidly. The declining share of the working-age population will affect economic growth.
– As of 2016, 11% of the Thai population (about 7.5 million people) are 65 years or older, compared to 5% in 1995.
-By 2040, it is projected that 17 million Thais will be 65 years or older – more than a quarter of the population.
-Together with China, Thailand has the highest share of elderly people of any developing country in East Asia and Pacific.
-The primary driver of aging has been the steep decline in fertility rates, which fell from 6.1 in 1965 to 1.5 in 2015, as a result of rising incomes and education levels and the successful National Family Planning Program launched in 1970.
-The working-age population is expected to shrink by around 11% as a share of the total population between now and 2040 – from 49 million people to around 40.5 million people.
This decline in the working-age population is higher in Thailand than in all other developing East Asia and Pacific countries, including China.

https://disasterresearchnotes.site/archives/2785

https://disasterresearchnotes.site/archives/2753

* World Population Prospects
https://esa.un.org/unpd/wpp/

** World Bank, 2016
Thailand Economic Monitor – June 2016: Aging Society and Economy

Disaster data and statistics can be referred by the following link:
http://www.preventionweb.net/english/professional/statistics/

Day_130 : Natural Disasters in China (2) – Two Earthquake Disasters


Two Earthquakes
Yang Zhang William Drake, et al. (2016)* indicates interesting views on two earthquakes disaster recoveries, the 1976 Tangshan earthquake and the 2008 Wenchuan earthquake. The point is, why the 2008 Wenchuan earthquake recovery was so rapid compared to the 1976’s earthquake.
However, the paper could add more about the total background changes of China such as society, economy, and politics. The china has changed dramatically after the 1976 from historical viewpoints.

The Tangshan earthquake is one of the deadliest disasters in the world and the Wenchuan earthquake is one of the top ten costliest disasters in the world also. Munich Re ranked the Wenchuan as the top four costliest disaster after the Japanese Tsunami (2011), the Hurricane Katrina (2005). and the Kobe Earthquake (1995). The number of deaths caused by the Tangshan is still controversial because of the Chinese government’s political climates at the time.

A Comparison of the two earthquakes

tanchanwenchan
Yang Zhang William Drake, et al. (2016)

The Rapid Disaster Recovery after the 2008 Wenchuan earthquake
Yang Zhang William Drake, et al. (2016) describes the following points, historical and socio-economic contexts, why the 2008 Wenchuan earthquake recovery was so rapid compared to the 1976’s earthquake.

[Historical context]

  1. The Chinese government drew lessons from its handling of the Tangshan earthquake recovery. The government emphasized the importance of planning for coordinated reconstruction.
  2. China had established a strong planning institution to support its rapid growth agenda since the economic reform began in the late 1970s. The contrast of recovery planning between the two earthquakes highlights the notion that a pre-existing planning institution and pre-existing policy documents that describe development visions for a disaster area.

[Socio-economic context]

  1. China’s ability to promptly fund the earthquake recovery was far superior in the 2000s. China’s annual GDP in the year prior to the Wenchuan earthquake was 3.494 trillion USD 2007, which was 22 times its GDP in 1975.
  2. The earthquake happened less than three months before the Beijing Olympic Games. It was in the government’s best interest to move swiftly with the response and recovery to ensure social stability for the Olympic Games.
  3. The global economic downturn of 2008 might have also played a role in speeding up the earthquake recovery. To stimulate the economy, heavy investment in the earthquake recovery became a convenient policy option.

However, many things can be added about the above points such as the acceptance of international aids (Day_95).

http://disasters.weblike.jp/disasters/archives/2971


This rapid recovery from Wenchuan reminds us the Japanese historical trends  from 1945 to 1959, especially after the Typhoon Isewan in 1959. The Haiti’s cases, 2010 Earthquake and 2016 Hurricane Matthew also can be found as the same analogy (The below related articles across the web).

The Meanings of the Lessons
We cannot experience the disasters so often, of course, we do not want to have disasters. This is why we should learn from the past disasters and this is what we can do all the time.

*Yang Zhang William Drake, et al. (2016) Disaster Recovery Planning after Two Catastrophes: The 1976 Tangshan Earthquake and the 2008 Wenchuan Earthquake, International Journal of Mass Emergencies and Disasters, 34(2):174-203

[ad#ads1]


Day_124 : Chain Reactions of Economic Damage- 2011 Chao Phraya River Flood in Thailand (3) Horizontal and Vertical Damage Exacerbations

Continue to explain the chain reactions of economic damage caused by Chao Phraya river flood. There were horizontal and vertical damage exacerbations types.

Concerning the horizontal damage exacerbations, we sometimes neglect indirect severe impacts caused by disasters. However, in this global world, economic activities are connected each other and so do the impacts. The following Figure 1 shows the three types of disaster exacerbations for example. The first category is “All or most factories of one’s own as well as those of partners suffer serious flood damage”. This category is the severest. The second category is “One’s factories suffer serious damage, but partners suffer no or light damage”. The third category is “One’s factories suffer no or light damage while partners suffer serious damage”. However, if the one’s factory totally relies on the partners which are affected by the disaster could have a very serious impact.

supply_holizontal
Figure 1  Damage types and severities (Horizontal)

With respect to the vertical damage exacerbation, the key word is the suppliers’ responsibility. For example, a big major car company has the responsibility for customers to supply cars, subcontractors have the responsibility for the car company to supply the parts,  sub-subcontractors have the responsibility for the subcontractors to supply the parts of the parts, sub-sub-subcontractors have the responsibility for the sub-subcontractors to supply the parts of the parts of the parts, and so on. The numbers of the companies become larger along with this vertical pyramidal structure. However, their resources are opposite as mentioned in Figure 2. Industrial estates and parks ordered the evacuation for the companies very slowly at that time of the flood because of some reasons (The reasons will be explained). However, the big companies continued their activities until the time, so sub and sub-sub and sub-sub-sub contractors could not evacuate until the bigger (upstream) companies’ evacuation decision making because of the supplier’s responsibilities. The big companies could evacuate so fast and effectively. They have the resources to do so. However, smaller companies could not evacuate so fast because they needed to wait until the bigger company’s evacuation decision and they tended to have limited resources along with the structure. They, for instance, could not move heavy machines to the upper floors. They did not have enough employees, systems, or plans to do so.

supply_vertical
Figure 2  Damage types and severities (Vertical)

These are the outlines of the disaster damage exacerbation of the supply chains.  These are presented at several meetings in Japan.

Day_122 : Japanese Disaster History after the Second World War (2)

Japanese disaster history has three turning points. The first is the Typhoon Isewan (Vera) in 1959. The second is the Kobe earthquake disaster in 1995, the third is the Great East Japan Earthquake and Tsunami (GEJET) disaster in 2011(Day_33).

https://disasterresearchnotes.site/archives/2439

You can see the following figure 1 which displays the dead and missing numbers caused by natural disasters in Japan.

deathtollafterww2
Figure 1 The dead and missing numbers caused by natural disasters in Japan

After the second world war, Japan was vulnerable, so we had a lot of natural disasters, especially Typhoon disasters from 1945 to 1959. We call this 15 years a great flood and storm era. The first hit was Typhoon Makurazaki on Sep. 1945.The typhoon disrupted Hiroshima city. There were 1229 casualties in the city. This fact reminds us what happened in Hiroshima in the same year (Day_34(Re)).

https://disasterresearchnotes.site/archives/2866

The Isewan Typhoon has the following aspects: 1) Physical damages were tremendous 2) Lack of consideration of disaster prevention 3) Inadequate flood defense system 4) Inadequate warning and evacuation system ( The details will be explained later) After the Typhoon Isewan, disaster countermeasures basic act was enacted in 1961. The act combined many disasters related laws into one. After the Isewan Typhoon, we Japanese had thought we were successfully mitigating natural disasters.  You can see the dead and missing numbers were dropped right after the Isewan Typhoon by Figure 1.  This is mainly because of infrastructures and the development of science and technologies such as warning systems along with Japanese rapid economic growth. In addition, we had, fortunately, no huge natural hazards until the Kobe earthquake in 1995.

After the period of1960-1994, we have faced the Kobe Earthquake in 1995. Then, we realized that we could not prevent natural disasters, however, we could mitigate natural disasters after the earthquake. We also learned the importance of soft countermeasures as well as hard countermeasures. The Japanese Government had changed the policies again. The Kobe earthquake facilitated volunteer activities. Many social scientists started to investigate disasters. Before the disaster, natural scientists and engineers are the main players to do disaster-related research along with Japanese infrastructure centered policies. After that, we had confidence again and we thought we could be a model for other countries. The World Conference on Disaster Reduction was held in Kobe in 2005. Kobe city tried to be a center of world disaster-related organizations. (This Kobe earthquake disaster will be explained later)

However, we faced the Great East Japan Earthquake and Tsunami (GEJET) disaster in 2011. The GEJET disaster became the worst ever disaster in Japan after the second world war. The GEJET broke the Japanese confidence again and reconsider our strategies.

To be continued

*Disaster countermeasures basic act:
http://www.preventionweb.net/english/policies/v.php?id=30940&cid=87

sponsored link

Day_121 : Chain Reactions of Economic Damage- 2011 Chao Phraya River Flood in Thailand (2)

Continue the last topic.

http://disasters.weblike.jp/disasters/archives/3257

There were three inquiries to ponder as follows:
1) Why were so many foreign companies coming and making supply chains?
2) What kinds of damage types could be analyzed and how about the influences?
3) How did companies respond?

Concerning the 1) Why were so many foreign companies, especially Japanese companies coming and making supply chains? There are reasons from Thailand and Japan sides. The first, Thai national government tried to de-centralize to narrow the gaps between Bangkok and other regions because so many things concentrated in Bangkok. To do this, establishing industrial estates and parks is the one of the effective ways to mobilize the people, things, and investments from Bangkok to the regions. The national government also had set some tax incentives to motivate foreign companies to come. Thailand is the very nice place for Japanese to stay because of the education systems, medical services, abundant labor force, people’s character, safety, and so on. The second, Japan had faced the problems of the rising yen after the Plaza agreement in 1985. Big companies, especially manufacturers, which had international businesses decided to move to Thailand to produce their products. After the bankruptcy of Lehman Brothers in 2008, the world economic climate became worse and the yen’s price was getting higher and higher again. Small companies, this time, could not endure the situations and moved to Thailand to deal with the big companies which already transferred in Thailand. Again, the attached graph (Figure 4) indicates so many Japanese companies came these areas after 1985, the year of the Plaza Agreement.  A number of  the JCC (The Japanese Chamber of Commerce) BKK member reflects the situations.

japanese-companies
Figure 4  Japanese enterprises coming to Thailand

To be continued…………..

Day_120 : Chain Reactions of Economic Damage- 2011 Chao Phraya River Flood in Thailand (1)

2011 Chao Praya river flood gives us a lot of lessons. The disaster is the 7th costliest disaster worldwide since 1980 to 2014 (Figure 1).

deadliest
Figure 1  10 Costliest events

From economic damage points of views, the below is the industrial estates and parks which were affected. 7 estates and parks were inundated. 804 companies were affected and among those, 449 were Japanese related companies in these estates and parks(Figure 2).

pic_industrial-estates-and-parks
Figure 2 7 Inundated industrial estates and parks

Can show you a brief outlines of the chain reactions of economic damage caused by 2011 Chao Phraya river flood. There are three main inquiries to ponder (Figure 3) : 1) Why were so many foreign companies coming and making supply chain? 2) What kinds of damage types could be analyzed and how about the influence? 3) How did companies respond?

3questions
Figure 3  3 Research Questions (rough skech)

These will be explained later. The attached graph (Figure 4) indicates so many Japanese companies came these areas after 1985, the year of the Plaza Agreement.

japanese-companies
Figure 4  Japanese enterprises coming to Thailand

Horizontal and vertical damage exacerbations types can be shown in the following figures.

supply_holizontal
Figure 5  Damage types and severities (Horizontal)

supply_vertical
Figure 5  Damage types and severities (Vertical)

To be continued…………..

Day_119 : Disaster Trends and Incomes

Asia is the most vulnerable in terms of natural disasters, for example, 7 of 10 of the deadliest natural disasters (1980-2014) took place in this region. The damage trend from natural disasters is from human sufferings to economic damage along with countries’ developing process. This trend is also the same with world views, developing countries to developed ones.

The following figure indicates low-income countries tend to produce a huge number of casualties.

income

The past posts assists the above explanation.
Concerning the trends:

http://disasters.weblike.jp/disasters/archives/2490

Regional characteristics:

http://disasters.weblike.jp/disasters/archives/2785

Day_117 : Bangladesh-Disasters, Lands, and Statistics (2)

Bangladesh has had a lot of cyclone disasters in the history. Table 1 indicates
the past cyclone disasters. Especially, we can see the 1970 and 1991’s cyclone
disasters are severe and caused many casualties. The bellows are some reviews
of Day_110 contents.

Table 1 Cyclone disasters in Bangladesh

banglacyclonehistory.

Table 2 picked up two disasters. We can compare the two. What can we say about this? Affected population was tremendously increased from 1970 to 1991. On the contrary,
the dead and missing number was decreasing. How about 1991’s cyclone disaster?

Table 2  1970 and 1991’s cyclone disasters*
banglacyclone19701991

Please check the dead and missing number and livestock damage.
You may have a strange feeling. The dead and missing number is
so rough.  However, livestock damage number is so precise. This
could reflect the cultural and social backgrounds.

banglasand
Figure 1 Sandwip Island History

We can consider a caste system somehow to understand the number.
The Brahmaputra river from the east and the Ganges river from the west bring a lot of sand to make lands in the Bay of Bengal. The people had a low status tended to live there actually.
They are easily influenced by the cyclones. In other words, they tended to die by the events.
Figure 1 shows the land, such as a Sandwip island was changing its shape by cyclones.

banglashelter
Figure 2   1970 and 1991 cyclones

Figure 2 indicates the shelter which was built after the 1970’s cyclone (with JICA’s  scheme)
saved a lot of people’s lives. However, there were some cultural issues. For example, the shelter’s number was limited, so it was crowded in the shelter.  This situation made females difficult to evacuate to the shelter. They tended to avoid to stay with males in the crowded situation. The livestocks are treated as their important assets. This also reflects their culture.

The one of the research findings after the 1970’s cyclone show the  38% of the survivors were survived by climbing trees (Figure 3).

evacuationsbangla
Figure 3 A shelter and a people climbing the tree

* The sources(Figures) will be added later.

Day_110 : Bangladesh-Disasters, Lands, and Statistics (1)

Bangladesh has had a lot of cyclone disasters in the history. Table 1 indicates
the past cyclone disasters. Especially, we can see the 1970 and 1991’s cyclone
disasters are severe and caused many casualties.

Table 1 Cyclone disasters in Bangladesh*

banglacyclonehistory.

Table 2 picked up two disasters. We can compare the two. What can we say about this? The affected population was tremendously increased from 1970 to 1991. On the contrary,
the dead and missing number was decreasing. How about 1991’s cyclone disaster?

Table 2  1970 and 1991’s cyclone disasters*
banglacyclone19701991

Please check the dead and missing number and livestock damage.
You may have a strange feeling. The dead and missing number is
so rough.  However, livestock damage number is so precise. This
could reflect the cultural and social backgrounds.

The 1991 cyclone hit Sandwip island and Chittagong city. Figure 1
shows the map.

banglamap
Figure 1  Sandwip Island and Chittagong (Map source: Microsoft Group)

To be continued…….
*Table 1 and 2 ‘s source will be mentioned later.

Related books and info. for further understanding


sponsored link

Day_106 : Myanmar-This week’s earthquake and the past trends

Myanmar had a huge earthquake (M6.8) on 24Aug2016.
The outline of the information can be checked by the ADRC website (Figure 1).

Myanmar Earthquake
Figure 1  Myammar Earthquake 24Aug2016 (ADRC)

“A powerful 6.8 magnitude earthquake struck central Myanmar, killing at least three people and damaging nearly 200 pagodas in the famous ancient capital of Bagan. The quake was also felt across neighboring Thailand, India and Bangladesh, sending panicked residents rushing onto the streets (AFP).”

Let’s check the disaster data.
The Figure 2 Figure 3 are the 1900-2016 top 10 deadliest and costliest disasters  in Myanmar (EM-DAT).

Myanmar death toll 2
Figure 2 Totals Deaths (Top 10 deadliest natural disasters in Myanmar)

Myanmar economic damage 2
Figure 3 Total damage (Top 10 costliest natural disasters in Myanmar)

We can confirm how the 2008 Cyclone Nargis was influential.
Many natural disasters which have high total deaths numbers occurred before 2000 (7/10).  On the contrary, many high economic damage natural disasters hit after 1990 (8/10).  These facts support the following “disaster is from human suffering to economic damage with development process”.

The notes on the recent major events (ADRC) are as follows:

1) Cyclone Nargis (May 2008)
Cyclone Nargis hit Myanmar in May 2008 which killed 84,537, with the missing 53,836, injured    19,359. 450,000 houses were destroyed, with another 350,000 damaged. Total affected people     were 2.4 million. The total economic loss was US$ 4.1 billion (according to Post-Nargis Joint         Assessment- PONJA).

2) Indian Ocean Tsunami (December 2004)
Indian Ocean Tsunami occurred off the Sumatra Island on 26 December 2006 killed 61,                 injured 42, affected 2,592 and destroyed 601 houses in Myanmar.

*The numbers of deaths are not the same with different sources. This is the one of the most important challenges of disaster research.

We can especially consider the political conditions for understanding the 2008 Cyclone Nargis disaster exacerbations. During the disaster, the county had refused international aids.

[ad#ads1]