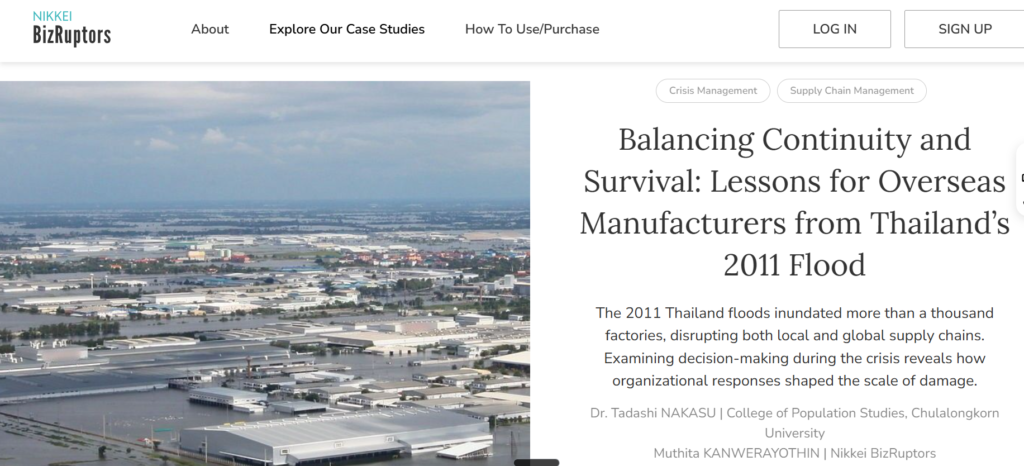
Balancing Continuity and Survival: Lessons for Overseas Manufacturers from Thailand’s 2001 Flood


This infographic was presented at RIHN in Japan as part of the Prof. Ito project, as part of the Feasibility Study. The infographic website is: https://disasters.weblike.jp/IOT%20v2.html
The presented numbers should be confirmed. Especially, the foreigner’s death toll and the Thai national death toll, with their proportion, are under reinvestigation.

An infographic, “Myanmar Earthquake 2025 Educational Sector Impact & Recovery Roadmap,” was created. Myanmar Earthquake 2025 Educational Sector Impact & Recovery Roadmap
*Please note that these are my research results, for my memo.
Step-by-Step Guide for Excel Regression Analysis
1. Prepare Your Dataset in Excel
Dataset Overview:
Create an Excel file (e.g., DisasterData.xlsx) with the following columns and sample data:

Objective:
Use the earthquake magnitude (independent variable) to predict economic loss (dependent variable: MN USD) through simple linear regression.
2. Enable the Analysis ToolPak
Excel’s Data Analysis ToolPak is required for regression analysis. If it’s not already enabled:
3. Visualize the Data
Before running the regression, it’s helpful to visualize the relationship:
This chart helps you see if there’s a linear trend between the two variables.
4. Conduct the Regression Analysis

5. Interpret the Regression Output
Excel will generate a regression output that includes several key pieces of information:

6. Use the Regression Model for Predictions
Once you have the coefficient and intercept from the output, you can create a prediction formula:
Y=(slope)X+(intercept) Y:Economic_Loss X:Earthquake_Magnitude
<Interpretation for beginners>
Multiple R (Correlation Coefficient):
R Square (Coefficient of Determination):
Adjusted R Square:
Standard Error:
Observations:
The ANOVA table helps you see how much of the total variation in Economic_Loss is explained by the regression (model) versus how much is left unexplained (residual).
df (Degrees of Freedom):
SS (Sum of Squares):
MS (Mean Square):
F and Significance F (p-value for the overall model):
This table provides information about the intercept and the slope of your regression line.
Intercept (Coefficient):
Earthquake_Magnitude (Coefficient):
Regression Equation:
Predicted Economic Loss=−152.261+(28.6965×Earthquake Magnitude)
In summary, these regression results show a strong linear relationship between Earthquake_Magnitude and Economic_Loss. The model explains about 93% of the variation in economic losses, and both the intercept and the slope are statistically significant. However, as with any statistical model, interpret the results with caution and consider real-world factors that may affect the outcome beyond just magnitude.
From Tragedy to Leadership: The Birth of ADRC
The Asian Disaster Reduction Center (ADRC) was established in 1998 following the devastating Great Hanshin-Awaji Earthquake (commonly known as the Kobe Earthquake) that struck Japan in 1995. This catastrophic event became a catalyst for change, transforming how Japan—and later Asia—approached disaster management and resilience.
Kobe’s Remarkable Recovery Journey
Kobe’s recovery story stands as a powerful testament to resilience and strategic rebuilding. Within just 9 years after the earthquake, Kobe’s population returned to pre-disaster levels—an extraordinary achievement considering the scale of destruction. This recovery wasn’t merely about rebuilding structures but reimagining the city’s future role.
HAT Kobe: A Hub for Disaster Reduction Excellence
Today, Kobe has reinvented itself as a global center for disaster reduction policies and activities. The area known as HAT Kobe hosts numerous disaster-related organizations, including ADRC. The name “HAT” carries dual significance:
This wordplay perfectly captures Kobe’s transformation from a disaster-struck city to a knowledge hub that helps others prepare for and respond to unexpected disasters.
Learning From Kobe: A Model for Disaster Recovery
Kobe’s recovery process offers valuable lessons for communities worldwide facing similar challenges. The city demonstrates how effective post-disaster planning can transform tragedy into opportunity, creating not just infrastructure but institutional knowledge that benefits others.
ADRC’s Mission Across Asia
ADRC plays a vital role in sharing disaster reduction expertise with its member countries throughout Asia. The organization:
Resources for Disaster Management Professionals
ADRC maintains comprehensive resources that disaster management professionals can access:
These resources provide valuable insights into regional disaster management systems, country-specific approaches, and up-to-date information on current disaster situations across Asia.
Building Regional Resilience Together
Through organizations like ADRC and the example set by Kobe, Asian countries are developing stronger collaborative approaches to disaster risk reduction. By learning from past experiences and sharing knowledge, communities across the region are better prepared to face future challenges with resilience and determination.
Today, I gonna explain how to use a pivot table to conduct disaster research using dummy data.
Imagine you have a big pile of data, and you want to see summaries or patterns quickly. A pivot table lets you rearrange (or “pivot”) that data to show different views, like totals, averages, or counts, without changing the original data.

dummy dataset

The sum of Aid by Disaster Type

Sorted Table
Key Insights from Disaster Research Pivot Tables
By experimenting with different field combinations, you can uncover valuable insights from your disaster research data. Pivot tables transform complex datasets into actionable intelligence for disaster management, policy development, and resource allocation.
Content Gap Opportunities
You cannot copy content of this page