Day_103 : New Orleans and Hurricane Katrina in 2005

Day_100 indicated a human suffering exacerbation process in New Orleans during the 2005 Hurricane Katrina.

http://disasters.weblike.jp/disasters/archives/2975

The Figure 1 again shows the relationships between the human suffering exacerbation process and social backgrounds with data. Table 1 also indicates the estimated death numbers in some wards.

exacerbation2
Figure 1 Human Suffering Exacerbation Process and Social Background

Table 1 Found Dead Bodies in New Orleans

dead in neworleans

The total views are indicated in the following Figure 2, 3, 4, and Table 2.
Concerning the population change, New Orleans is the one of the decreasing communities in US. For example, rapid urbanization related matters caused environmental degradation before the disaster. Campanella(2004)mentioned New Orleans became not a sustainable, but a survival city. The lower 9th ward, for example, with regard to the ethnicity, we can see the high black and the African American proportion.  With respect to Income, we can also identify the people living in the Lower 9th ward have lower incomes.

NOLApopulation
Figure 2  Population Change Louisiana( Light Blue ) and New Orleans (Dark Blue)


2000census
Figure 3 Percent Black or African American, 2000 (Census, 2000)

pop and ethnicities
Figure 4 Percent Black or African American and White
(Source: Congressional Research Service)

Table 2 People’s Income in both New Orleans and Lower 9th Ward

income katrina

These are referred by an NIED publication.

Day_102 : World Disaster Chronology 1977

The chronology will be improved little by little. This is the first draft version. The information source will be shown later. In addition, other some events will be explained.

Date Place Disaster Type Situations
1977.01- US East Cold wave The dead and missing number is 75
1977.01- Bolivia, East Heavy Rain, Flood The dead and missing number is 100
1977.01- Africa, East (Democratic Republic of the Congo and close to Rwanda) Volcano Disaster Mount Nyiragongo eruption. The dead and missing number is over 2,000. Lava flows and volcanic gases make the disaster worse.
1977.02- Mozambique Heavy Rain, Flood The dead and missing number is 250
1977.03.04 Romania , Central East Inland Earthquake 1977 Vrancea earthquake *  M7.5 : The dead and missing number is 1,400-1,600Mainly in  Bucharest)
1977.03 Iran, South Coastal Earthquake Khurgu(north Bandar Abbas, Iran) earthquake The killed and missing number is 170.
1977.04.01 Bangladesh Tornado The dead and missing number is over 600
1977.04.06 Iran Inland Earthquake M(not confirmed) The dead and missing is 500
1977 Haiti Heat wave The dead and missing number is over 300
1977.06- Oman Typhoon, Flood The dead and missing is 110.
1977.07- South Korea Heavy Rain, Flood The dead and missing number is 200. Seoul city has a huge damage.
1977.07- US East Heavy Rain, Flood The dead and missing number is 100. Pennsylvania state.
1977.08.19 Indonesia, South(Sumbawa) Submarine Earthquake Sumbawa Earthquake : M7.9-8..3 The dead and missing is 180. A big Tsunami
1977.11- India Typhoon, Flood The dead and missing number is 10,000-20,000
1977.12.20 Iran Inland Earthquake M(not confirmed)The dead and missing number is over 500

*1977  Vrancea earthquake. The dead and missing number is not clear.
Communist ruler Nicolae Ceaușescu suspended his official visit to Nigeria and declared state of emergency (Wikipedia).  This case also shows the death toll tells.
http://disasters.weblike.jp/disasters/archives/3020

[ad#ads1]

Day_101 : Deth toll tells

The following Figure 1 is the death toll by country after the 2004 Indian Ocean Tsunami disaster.

death toll
Figure 1 Death toll by country

Then Table 1 indicates the death toll flow of each country.
What can we say about this?

Table 1 The Death Toll Flow
Death Flow

As you can see Table 1, the number of victims (deaths) is changing day by day. For instance, the number of deaths reported in Indonesia from 05.01.15 to 05.01.30 is decreasing. The death toll flow of Somaria looks somehow strange. If we can consider these kinds of views, we can understand that the reported death numbers reflect the social situations of the country. These views will be discussed later.

Next, Figure 2 shows the picture taken at the tsunami memorial meeting in Phang Nga province one year after the disaster. This definitely indicates so many foreigners were killed by the tsunami. Figure 3 support this fact. This is because the affected areas were sightseeing spots. Even Thai victims include so many visitors from all over the country.

pictures of memories
Figure 2  The Picture of the Tsunami Memorial Board

tsunami victims
Figure 3 Indian Oceans Tsunami Victims in Thailand

The victim’s nationality is so diverse.Figure 4 indicates the top 10 deadliest disasters (actually top 6 exist) in Sweden and you can know the Indian ocean tsunami is ironically the worst natural disaster in the history of Sweden (The fatality number is 543 Wikipedia).

sweden
Figure 4  Deadliest Disasters in Sweden (1900-2014) Source: EM-DAT

[ad#ads1]

Day_100 : A Human Suffering Exacerbation-Data from Greater New Orleans Community Data Center

The Greater New Orleans Community Data Center (GNOCDC) website was found after the field survey on Hurricane Katrina in Louisiana and Mississippi in 2005. I was so amazed. This is the one of the demographers great contributions to disaster research.

The site provides the information of the pre-Katrina situations by parish and also by ward. This is very useful to examine the social backgrounds of the areas in detail.

gnocdcPrekatrinaFigure 1 GNOCDC (Pre-Katrina data site)

The paper on Karina disaster using these data is to explain how human sufferings were exacerbated by the stage with the social background as shown in Figure 2 (Nakasu, 2006 :Sorry in Japanese, however, summary and figures are in English).

human suffering
Figure 2 Victimization Process

exacerbation2
Figure 3
Victimization Process by Stage

Table 1 Found Dead Bodies in New Orleans  

dead in neworleans

The process can be divided into five stages with time such as A) Pre-disaster B) Direct damage C) Social disorder D) Life environment  E) Reconstruction and recovery. Then, these are examined with the social background data (Figure 3).

For example,  1) Pre-disaster stage, I picked up an evacuation aspect to explain the social background of this stage.

Using the GNOCDC database, I could check the possession ratio of the vehicle in some areas.

novehicle
Figure 4 No Vehicle Available Ratio (GNOCDC)

Table 1 and Figure 4 show the people in Lower 9th ward, one of the most severely affected areas, had a low possession ratio of the vehicle. This can explain so many residents needed to have government help to evacuate and they could not evacuate before the Hurricane hit.

The general social background, such as ethnic groups, household incomes, and others with other stages of examinations will be discussed later.


The Great Deluge: Hurricane Katrina, New Orleans, and the Mississippi Gulf Coast (English Edition)

Day_99 : A Secondary Disaster- 1972 Shigeto Landslide Disaster

The Shigeto ward, Tosayamada town in Kochi prefecture had a huge landslide disaster on the 5th of July in 1972. We call it Shigeto Landslide.

What we can learn from this landslide is the secondary disaster.

First, a small landslide occurred at 6 am on the day. One volunteer firefighter was buried alive by the landslide. Other volunteer firefighters and local people started to conduct rescue work for him.

Second, a huge landslide happened at 10:55 am during their tasks and killed 59 among them. In addition, the landslide pushed the train stayed at Shigeto station away.

The following Figure 1 shows the landslide (NIED DIL)

shigetoupic
Figure 1 Shigeto Landslide

Day_98 : The Major Tsunami disasters in Sanriku Ria Coast in Japan

The following slide indicates the Great East Japan Earthquake and Tsunami(GEJET)disaster’s data by each municipality (IRDR conference).You can see the fact that Sanriku ria coast has more severe damage compared to the population of the municipalities.We also need to notice the Sanriku ria coast has a long history of tsunami disasters.But why did they have a sever damage again?

sanriku tsunami history death
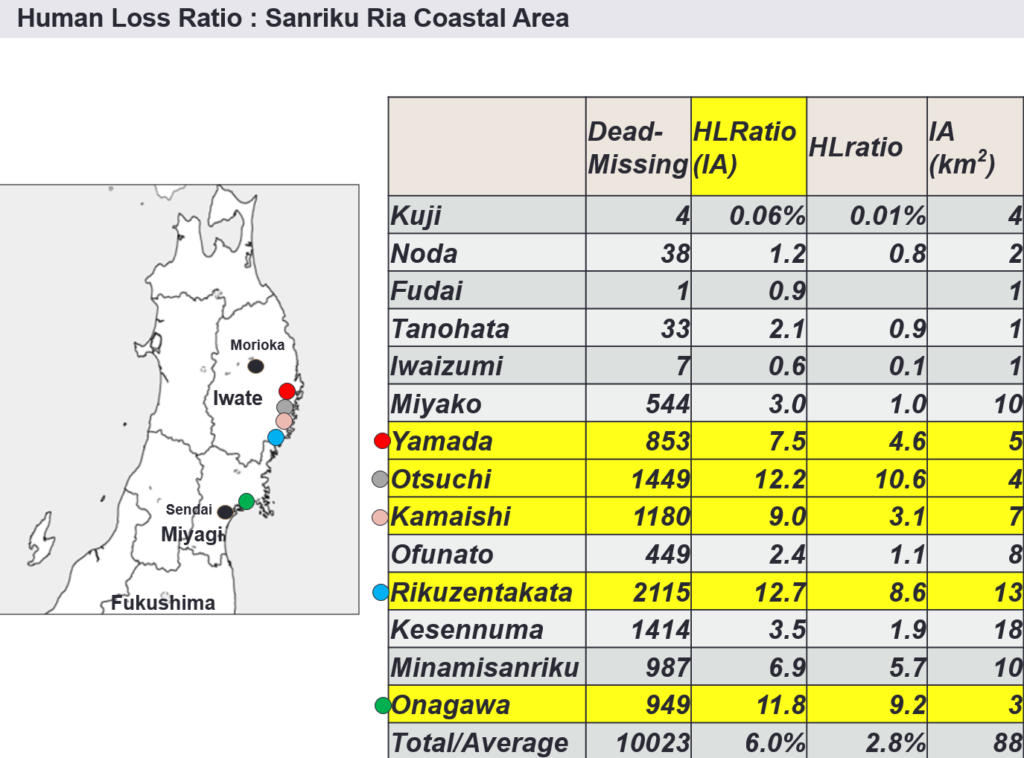
Figure 1 Tsunami Disaster Impact in the Sanriku Ria coast (IRDR)

The Sanriku areas have a special geographical condition mentioned as Sanriku ria coast. The coast has mountains close to the sea, so residential areas are limited only in the distributed, narrow and lower zones near to the sea and the areas become very vulnerable against the tsunamis. The bays in the coast are small and the sea inside the bays are very deep. This makes tsunami faster and higher, this is why the Sanriku ria coast makes the one of the highest tsunami risk areas in the world.

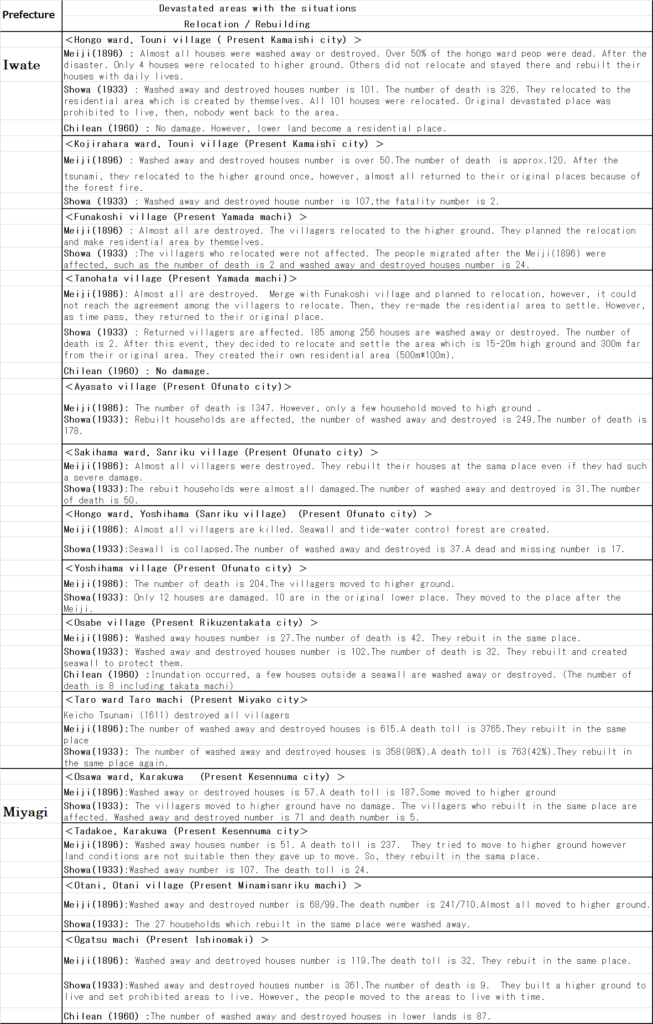
Because of these characteristics, the communities in Sanriku ria coast, mainly in Iwate prefecture historically has been severely affected by tsunami disasters such as Meiji Sanriku earthquake tsunami (Meiji (1896)), Sowa Sanriku earthquake tsunami (Sowa (1933)), and Chilean earthquake tsunami (Chilean (1960)) disasters compared to the flat coast mainly in Miyagi prefecture and other areas in Japan.

See the below “Relocation or Rebuilding (1)”

http://disasters.weblike.jp/disasters/archives/2950

The following is the brief explanations of each tsunami disaster. The Figure 2 (Figure 1 of the Day_94 post) does not include the Chilean Tsunami.

sanriku tsunami history
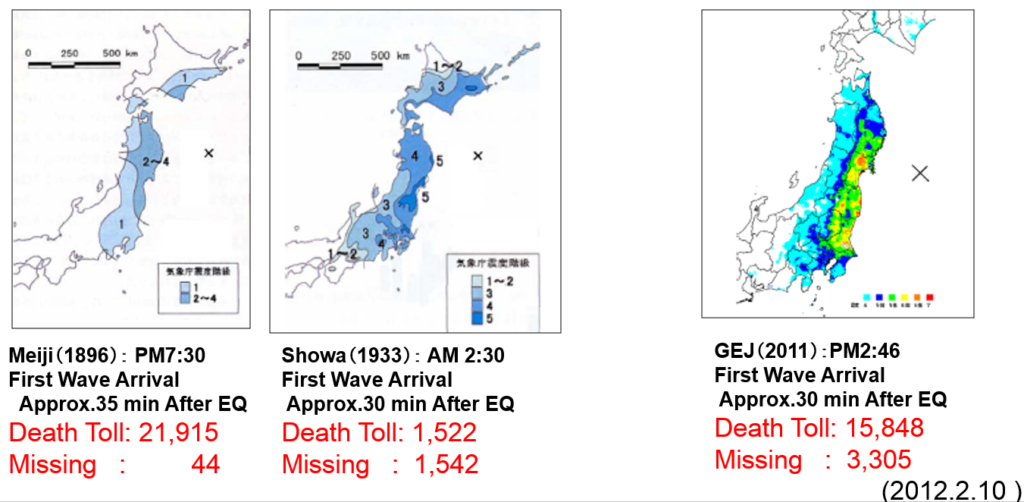
Figure 2
 The Tsunami Disasters in Tohoku (Cabinet office of Japan)

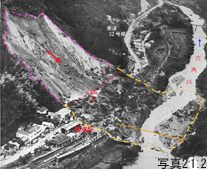
1) Meiji sanriku tsunami disaster(1896), this disaster is so called a surprise attack tsunami disaster happened at approx. 7:30 pm, 15th of June in 1896 mainly in Sanriku ria coast. The dead and missing number has reported over 22,000. The earthquake is not so strong (Japanese earthquake scale indicates Shindo 1-2), however, tsunami is very strong and high (max. height is 38.2m at Ayasato area (present Ofunato city) compared to the earthquake movement scale. The first wave arrival is approx.35m after the earthquake. The Meiji sanriku tsunami disaster (1896) is the worst tsunami disaster ever in Japan.

2) Showa sanriku tsunami disaster(1933), this tsunami disaster can be examined the lessons learned from Meiji (1933) mitigate the impacts. This tsunami attacked mainly the Sanriku ria coast at approx. 2:30 am, 3rd of March in 1933. Even if the midnight, the residents evacuated so quickly because of their memories of the Meiji (1896) with strong earthquake (Japanese scale is Shindo 5.5). The max. tsunami height is 23m at the same place, Ayasato area, with Meiji (1896). The first wave arrival is approx.30 min. after the earthquake.

3) Chilean tsunami disaster(1960), this is caused by the tsunami generated offshore in the long distance. This is coming from Chile in South America. The earthquake occurred in Chile was magnitude 9.5 and this huge earthquake generates tsunami and reach to Japan after 22 hrs and a half. The tsunami come approx. at 3 am, 23rd of March in 1960. The death number is 139 all over the Japan and Sanriku ria coast is the worst such as 63 in Ofunato, 37 in Shizugawa (present Minamisanriku), and 8 in Rikuzentakata.

4) Great East Japan Earthquake and Tsunami(GEJET) disaster(2011), this disaster is the deadliest disaster after the Second World War in Japan. The earthquake happened at 2:46 pm, 11st of March in 2011. The total casualty number is 19,846 based on the EM-DAT.The max.tsunami height is 40m at the Sanriku ria coast. The first wave arrival is approx. 30 min. after the earthquake.
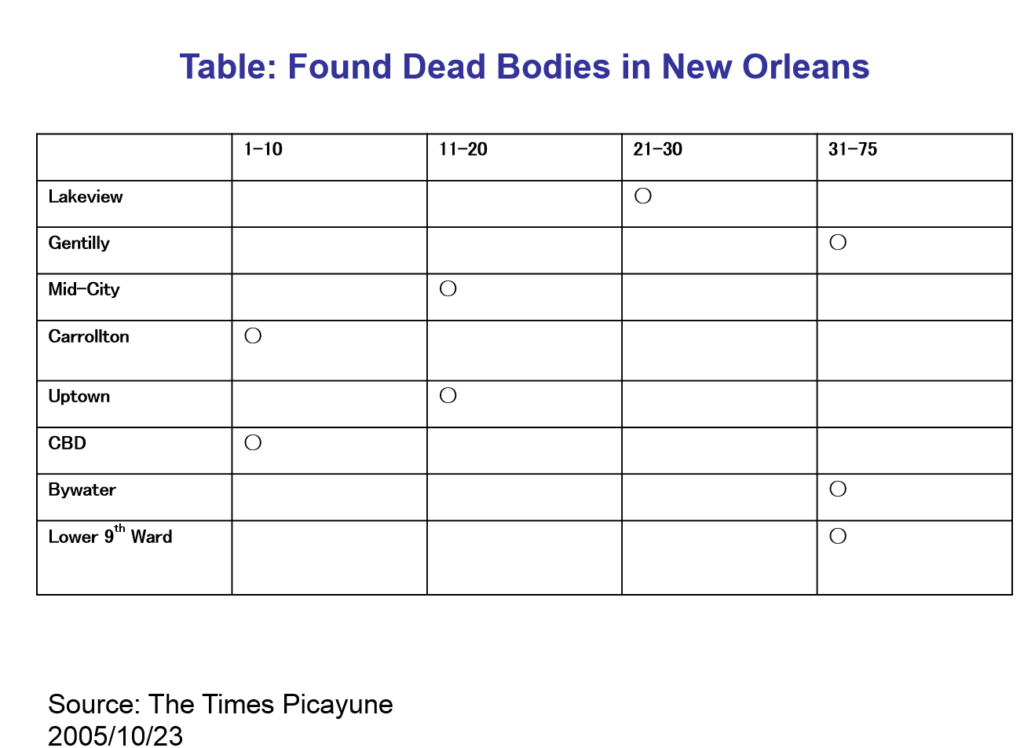
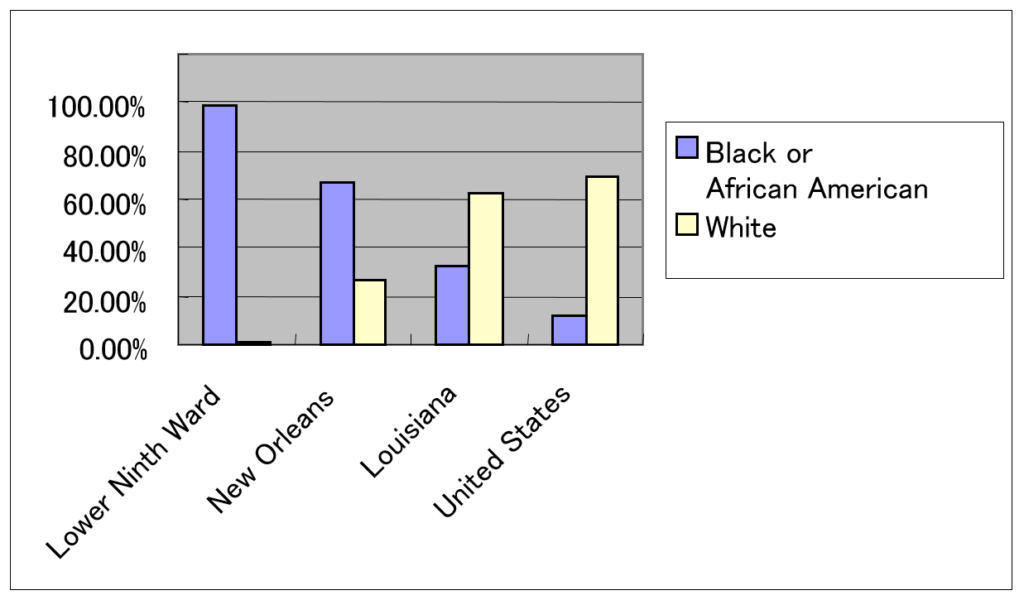
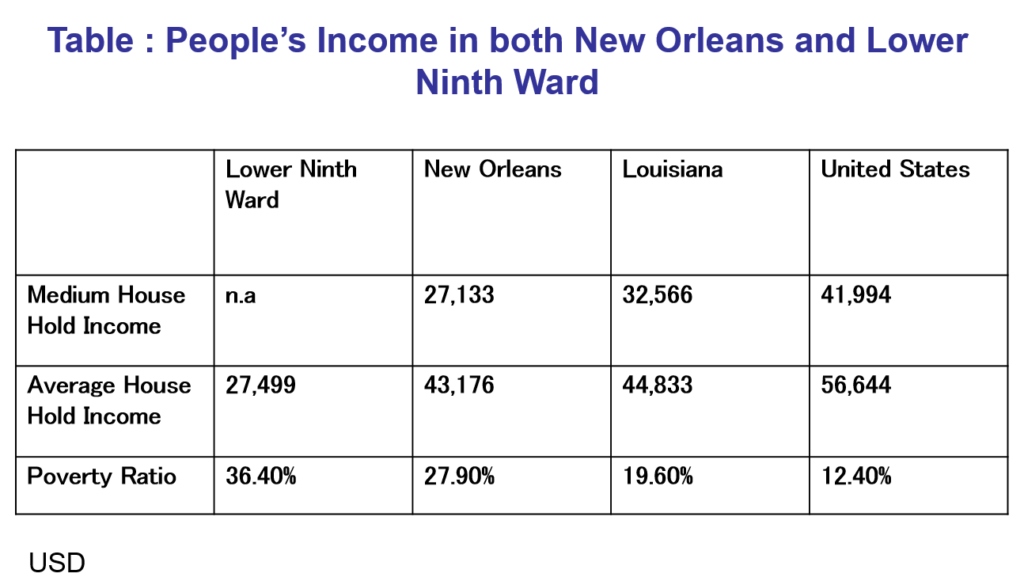
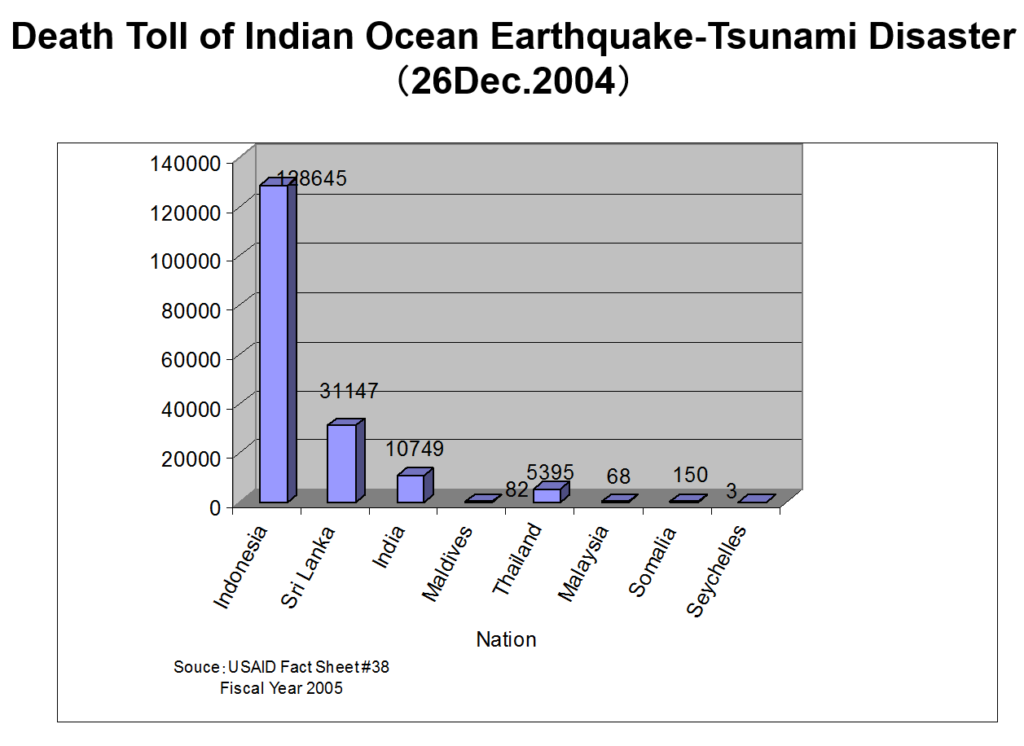
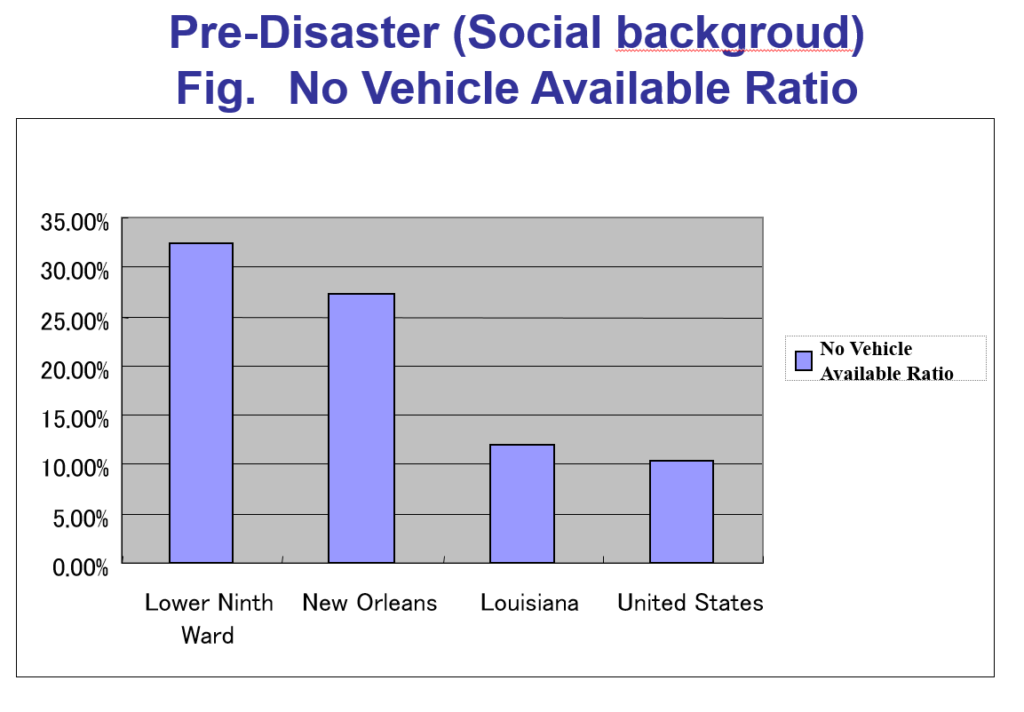
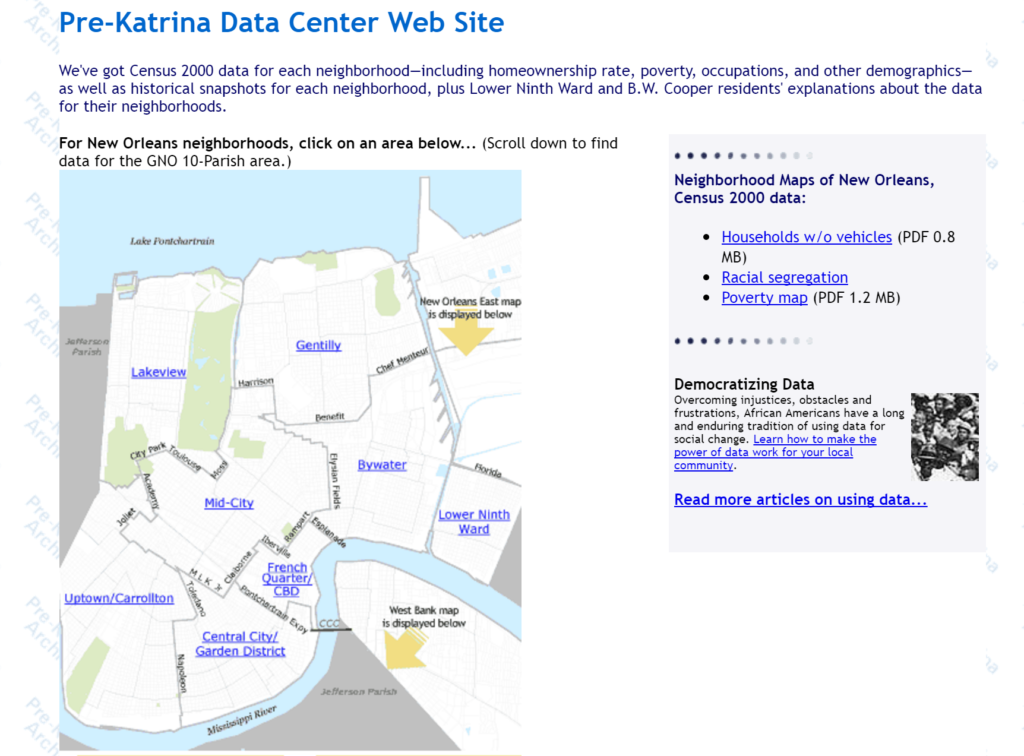
Day_97 : World Disaster Chronology 1976 (2)


Date Place Disaster Type Situations
1976.08.17 The Phillipines, South
Mindanao
Submarine earthquake 1976 Moro Gulf earthquake and tsunami*: M7.8-8.1,A dead and missing number is 4,000-8,000
1976.09- Japan Typhoon 1976 Typhoon No.17 Flood (Nagara river flood
A dead and missing number is 169, Injured 400
1976.10.28- Japan, North-eastern Strong wind Sakata conflagration: A death and missing 2, Injured over 900
1976.10.29 Indonesia, East Irian Jaya Inland earthquake M7.2, A death and missing number is 100-6,000not confirmed),landslide
976.11.24 Turkey and Iran border Inland earthquake  1976 Çaldıran–Muradiye earthquake**: M7.2-7.6, A death and missing number is 3,600-10,000
1976.12- Japan Snow  A death and missing number is 84, Injured over300, damage loss 40 billion yen

1976 Moro Gulf earthquake and tsunami*
The worst tsunami disaster in the Philippines.1) It happened while most people were sleeping.
2) No warning after the earthquake.

1976 Çaldıran–Muradiye earthquake**
The almost all houses were destroyed because of the structure constructed of thick walls made from rubble masonry cemented with mud mortar.

[ad#ads1]

Day_96 : Lessons from a Japanese Environmental Movement- The Matsumura Research Group (1)

Mishima Numazu Shimizu (MNS) environmental movement in 1963-1964 is the turning point of a Japanese environmental history. The core of the movement is the science-based issues, especially, Environmental Impact Assessmentsconducted by the Government Research Group and the Local Research Group.

They fought the results and local people finally assisted the local research group research findings and explanations to choose their future.

Actually, this is the first national EIA (Environmental Impact Assessment) in Japan, which failed and almost all Japanese do not know.

I conducted field research on the local research group for a long time. I stayed local member’s house for over 1 week and collected the documents, for example. Unfortunately, almost all members have passed away now. The followings are the outlines.

Background
In 1963, the national government and local councils proposed the one large industrial complex in Mishima city, Numazu town, and Shimizu town area in Shizuoka prefecture near to the Mt.Fuji.This was one of the largest development projects in Japan at that time. After this announcement, the MNS environmental movement was started with the local people. Local high school teachers and national research institute researchers led this movement with their scientific and local knowledge.

Revolutionary Events in the MNS Movement
– The survey carried out by high school students (KOINOBORI research)
because it happened  in a KOINOBORI time (Japanese culture)
→A high school teacher (The Matsumura Research Group member) led this survey.
→These results were accurate in the local wind direction which was against governmental research findings with explanations. Gov. research group had a huge budget, they used a helicopter to check the wind directions

koinobori
Figure 1 Koinobori   (Source: Wikipedia)

– A few hundred education programs (mainly for local citizens)

The Main Impact of the MNS movement
Former high-ranking officer confessed:
“We (the government) thought we had lost when the Numazu citizens flew those KOINOBORI (carp-shaped streamers) for research purpose. Besides that we also realized that we needed to make laws governing pollution. If we had not done it, we could not have been able to set up any MNS type projects”

The Main Impact of the MNS movement
Prevention Movement against Pollution
Local Government Reform Movement
Legal Action in the Movement
Conducting Independent Research
Implementing Environmental Education Programs

After the movement, Kawasaki City, Tokyo Metropolitan Area,
and Kyoto City became reformist local governments, which
control pollution more seriously than the national government.

Matsumura Research Group
Outcome: “Self Assessment” by the local research group overcome
the “Official Assessment” by the national research group

Mr. Shiramatsu (LDP) criticized during the time in the assembly:
“The Kurokawa Research Group (the national research group) is reliable.
It consists of the country’s most respected specialists in various fields.
They could be called the nation’s best brain. On the other hand, the
Matsumura Research Group (the local research group) is unreliable.
The member are 2 doctorates of Agriculture and 4 high school teachers.
How could they carry out reliable research?
In addition, I heard the budget
of the Matsumura Research Group is about 100 thousand yen. So the research
could be regarded a non-scientific thing”.

To be continued・・・・・

sponsored link

Day_95 : World Disaster Chronology 1976 (1)

Date Place Disaster Type Situations
1976.01- A northern part of the Philippines Heavy rain, Floods The death and missing number is over250, mainly Luzon island.
1976.01- Japan Disease Influenza, Over 1.8 million are affected, over 500 are dead (not confirmed).
1976.02- US and UK Disease Over 800 are dead. Influenza (not confirmed)
1976.02.04 Guatemala Inland earthquake Guatemala earthquake M7.5: A dead and missing number is 22,900, A major active fault line (over 200km) was found
1976.04.10 Bangladesh Tornado  The dead and missing number is 200
1976.05.06 A north-eastern part of Italy Inland earthquake Friuli earthquake M6.5A dead and missing number is 900-1,250
1976.06- US Heavy rain, Floods The dead and missing number is 140
1976.06- Japan North-Eastern Part Cold weather damage The total loss is over 400 billion yen
1976.06.26 Indonesia, EastIrian Jaya Inland earthquake M6.9-7.1, A dead and missing number is 5,000-9,000 (not confirmed)Many landslides occurred
1976.07-10 Mexico Hurricane, Floods Hurricane Liza*, The dead and missing number is 200
1976.07.14 Indonesia, South (Bali) Inland earthquake M6.5 (not confirmed), The dead and missing number is 560
1976.08- US West Heavy rain, Floods A dead and missing number is 60. Mainly in Colorado.
1976.08.28 China Hebei Province Inland earthquake Tangshan earthquake**, M7.3-7.8, The dead and missing number is 242,000-655,000 (750,000 not confirmed) 

* Hurricane Riza hit Mexico. The story will be discussed later.

**Remarks for disaster statistics and international assistance should be made about the Tangshan earthquake. First, the death toll is unclear because of china’s political climate. The earthquake occurred during the late stages of the Cultural Revolution. This makes difficult to have accurate statistical data. The earthquake contributed to the end of the Cultural Revolution. Second, the Chinese government refused to accept international aid from the United Nations and insisted on self-reliance. This influenced disaster exacerbation. One of the worst natural disasters in the world.

Day_94 : Relocations or Rebuildings (1) (Tentative)

The communities in the Sanriku ria coast have been affected by tsunamis for a long time. After huge tsunami disasters, they have had always faced the difficulty to make a decision, relocations or rebuildings.
The below Figure 1 is the major tsunamis in the Sanriku ria coast.
sanriku tsunami history
Figure 1 Tsunami disasters in Sanriku ria coast (Cabinet office of Japan)
The Meiji sanriku tsunami in 1896 was the worst tsunami disaster ever in Japanese recorded history. The Showa sanriku tsunami in 1933 occurred in the midnight, however, they evacuated well because of the Meiji’s experience. As mentioned before, they always needed to choose relocations or rebuildings with the consideration of their resources after the tsunami disasters.
The decisions of each community can be seen in Table 1 (Tentative).
Table 1 Relocations or Rebuilding History of Communities after the Tsunami Disasters(Tentative Table: very rough translation, sorry. Will change soon)
                                                                                                      Ref. ( Nakasu,Tanaka, Miyake, 2011)
relocations2
Some communities relocated to higher grounds after the tsunamis, however, they tended to go back to the original places because of their daily life’s convenience. They are mostly fishermen or making their living by the sea. We can imagine how difficult for them to live in the ground, far from the sea.
To be continued.