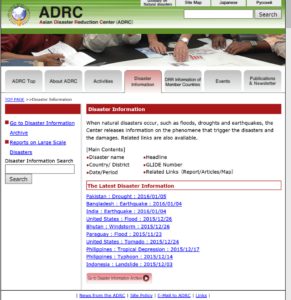
Below is the disaster links site, which was created a long time ago. I will renew this site step-by-step. In addition, some are still only in Japanese, and original disaster-related pictures are omitted, so I will also consider these.
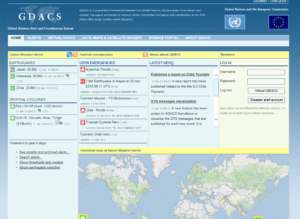
The below disaster-related world organization’s link site is the one that was built when I was working at NIED DIL and is still working as one of the products there. I am very happy to know that, but I would also like to renew this to contribute to the institute with my gratitude in the near future, I hope.
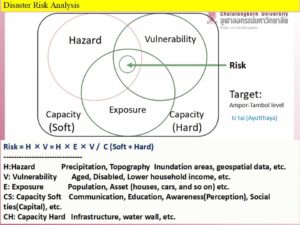
Disaster researchers often refer to the PAR (Press and Release) model to understand the risk.
The PAR model was described in the book “At Risk”. This book is a kind of bible for disaster researchers. Disaster Risk is described as an overlapped area between Hazard and Vulnerability.
The Disaster risk should also consider “Exposure” and “Capacity”. The capacity has mainly two parts, Hard and Soft. In short, Capacity Hard (CH) means tangible factors and Capacity Soft(CS) means intangible ones. For instance, infrastructure is CH and education is CS. The Disaster risk usually can be identified by the following picture. Figure 1 indicates the above.
Figure 1 Disaster Risk
Using the below equation, disaster risk would be identified.
Disaster Risk = H*E*V/ (CH+CS)
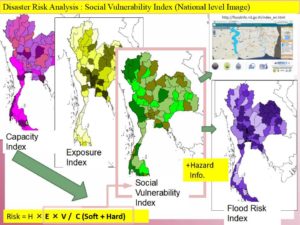
Each factor such as E (Exposure) could be identified by mainly statistic data in the target area.
To do this, the indices can be established. The data to contribute each factor should be carefully examined.
Figure 2 is the national level Index Image of Thailand.
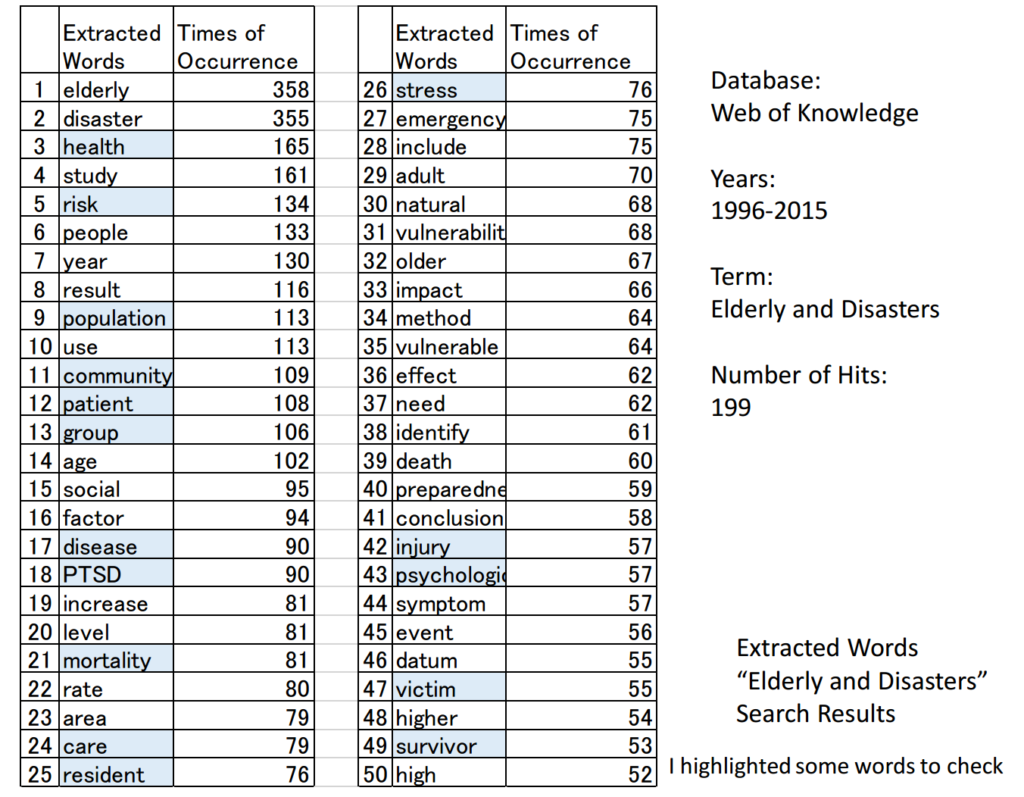
Overviews of the Literature concerning elderly and disasters by text mining.
<Method>
1. Search the keywords in Web of Science (Core Collection)
2. Selected Information (Titles and Abstracts) was gathered into one text file.
3.1st contents analysis has been carried out and omitted the unnecessary words.
4. Cleaning process
5. 2nd contents analysis has been carried out. >>This process was repeated
6. Research findings are examined.
7. Examine the extracted words and phrases by reaching to the original abstracts and original papers.
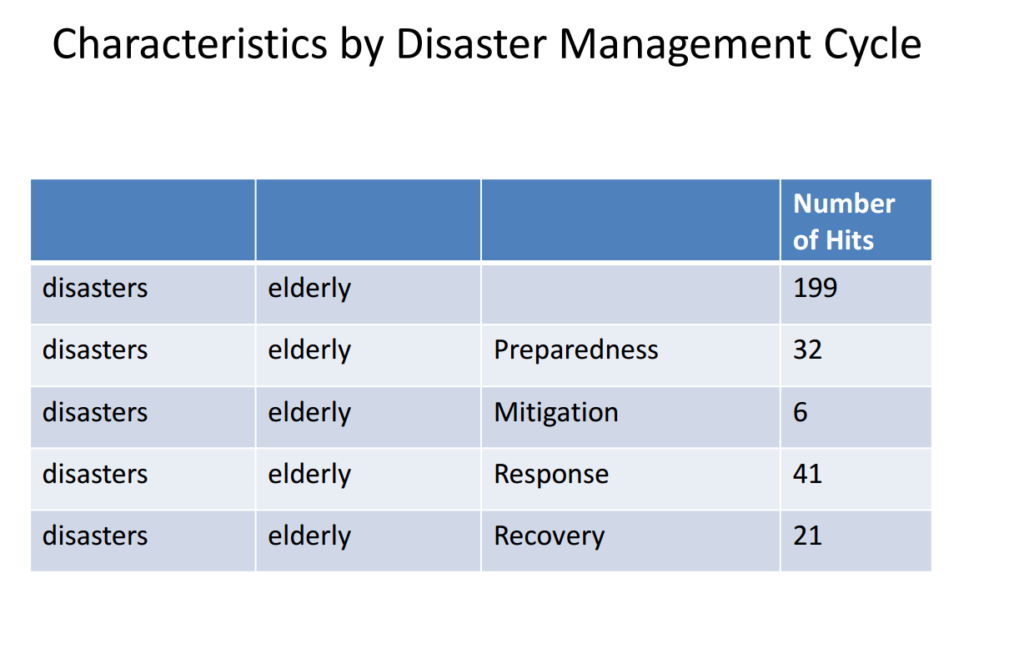
Table 2 The hit numbers with disaster management cycles’ stages
Table 2 indicates that elderly issues on disasters are more discussed in relation to “response” and “preparedness” than “recovery” and “mitigation” in the disaster management cycles’ stage.
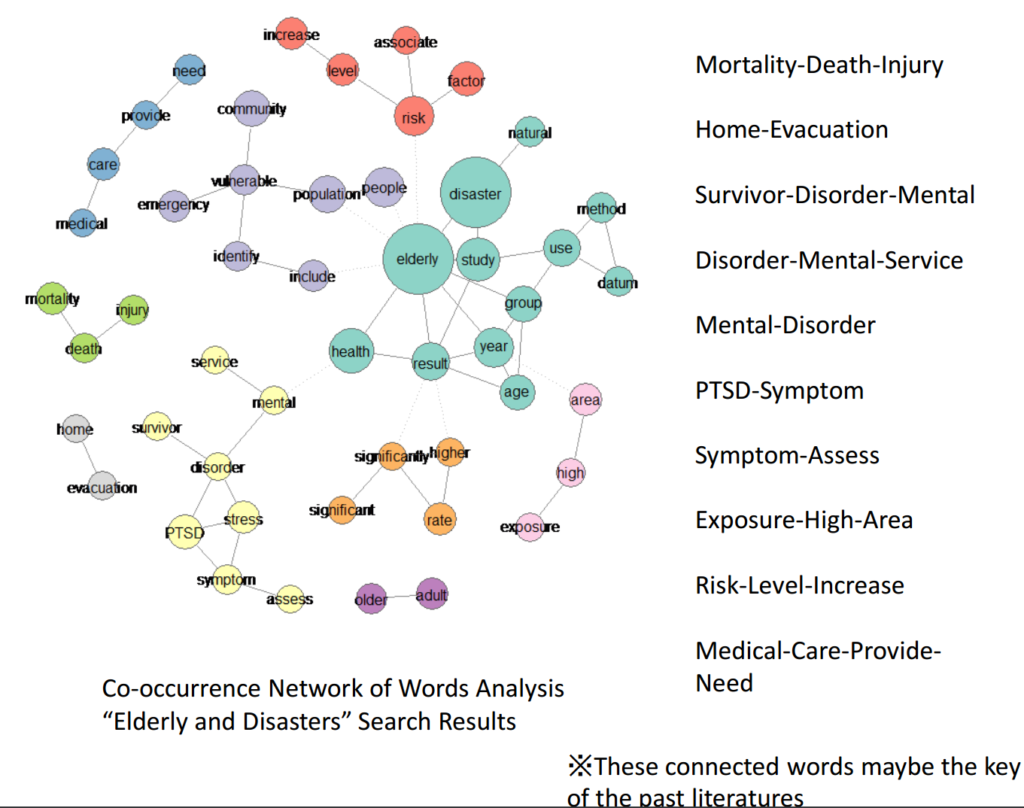
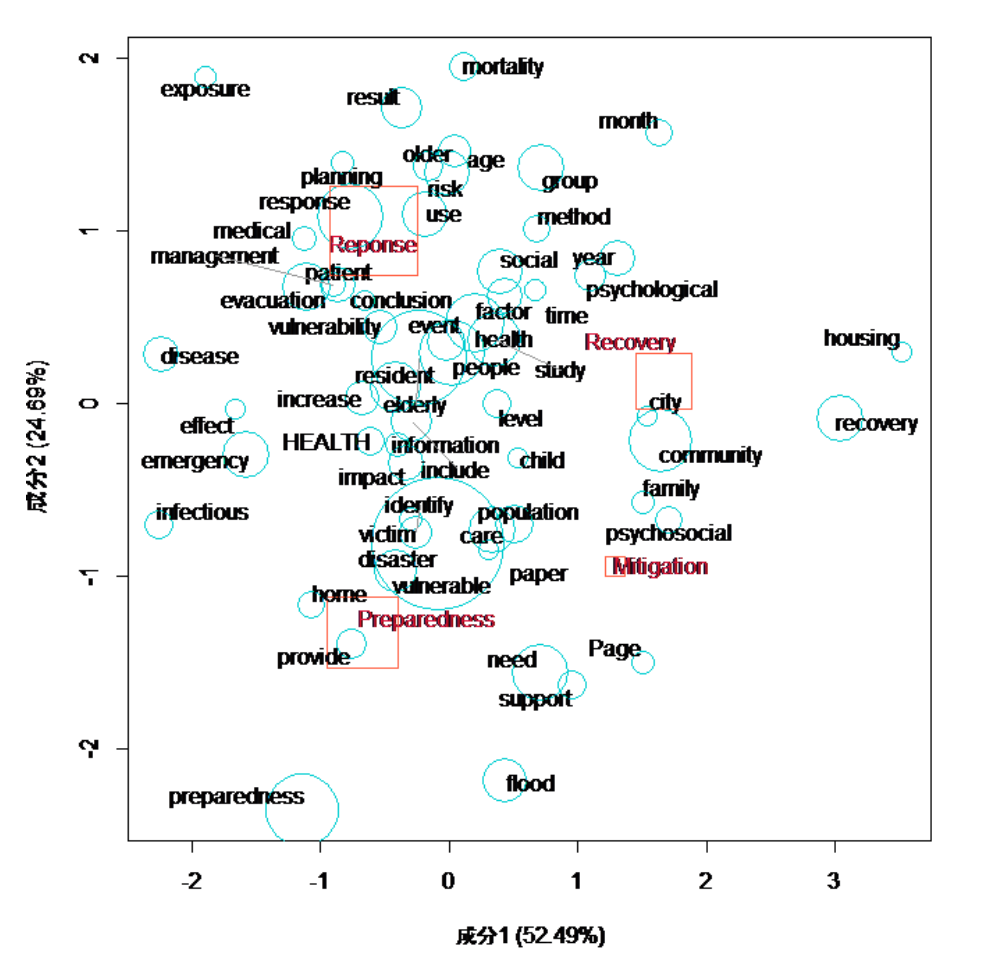
Figure2 Correspond analysis (The related words with disaster management cycles’ stages)
For example, Figure 2 suggests the close relationship between response and related words such as planning, management, medical, evacuation, vulnerability, and patient. This suggests the elderly’s difficulties for evacuation because of their physical conditions.
**This article is a revised version of Day_26(rev)
Past columns will be updated both in Japanese and English.
My past Japanese writings for an internet newspaper company and the research map researcher’s blog (Japan Science and Technology Agency’s site) can be checked in the following, but the article of the news company is not free and is not in English or Japanese.
Provincial (States) Level
1. Government Office (National Statistics Office,etc.)
Community Level
1. Local Government Office
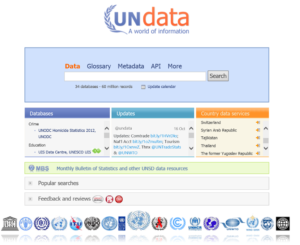
When we investigate the disasters, we firstly go to the ADRC (if the country is Asia) and Relief Web to see some significant numbers such as the death toll and affected numbers. Then, check the disaster history of the target areas by EM-DAT and Desinventar (if the country is listed). We also overview the county’s background by CIA world fact book and check some socio-economic data by UN or World bank open data. In addition, the local government or community data of the target area are significant to be accessed. These are the primary action to grasp the whole picture of the disaster.
Thai News mentioned that “Thailand declares disaster zones after floods kill 14“.
The created National Disaster Risk Assessment Mapping indicates flood disaster countermeasure is the first priority in Thailand(Day_93 ).
The Thai Disaster Chronology also suggests that southern provinces of Thailand are the most vulnerable areas to the floods (Day_134,135). We can learn from the data.
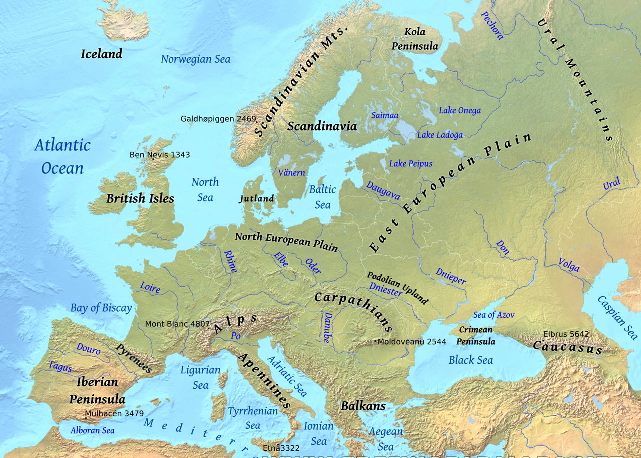
Concerning hydrological, meteorological, and climatological disasters, heavy rain and storm disasters are caused by low pressure in the Icelandic area developed in the winter season. A cold atmospheric current coming from Arctic gains a warmer vapor stream from the Gulf Stream and develops a strong atmospheric depression in the area. This causes the strong winds and high tidal waves along the coastal areas of the North Sea. Netherlands and England can be highlighted. The Netherlands had storm surges in 1530 and 1570. The death tolls were approximately 400,000 (1530) and 70,000 (1570) for each. The 1953 depression took 1800 deaths. This disaster also reached England. England’s disasters were the 1703 Thames river flood and the 2003 Heatwave. The temperature was 8–10 over an average year in August 2003 (Day 38).
Danube, Elbe, Rhine, and Seine rivers are on a gentle slope, causing slow inundations caused by heavy rains. On August 2, 2002, Central Europe had heavy rain, which caused the Danube and Elbe rivers to overflow in Germany, Czech Republic, Austria, and Hungary. The death toll is approximately 100; the number of people affected is over 100,000. Historical buildings in the city, such as Prague,Dresden, and so on, along the rivers, were also inundated.
The Alps have had landslides, debris flows, slope failures, and so on. The particular example is the landslide in the Dolomites, North Italy, in 1963. Overflows from Vajont dam caused by a large-scale landslide attacked the village in downstream areas. The death toll is approximately 2600.
A brief explanation
An interview-based explanation
On August 2003, West Europe had 8–10 degrees celsius higher than the average. This heat wave killed 15000 in France, 7000 in Germany, 4000 in Spain, 4000 in Italy, and so on, for a total of 35000.
In summer 2010, Russia had a heat wave and this makes wildfire. The wildfire was spread out and it took over 1.5 months to extinguish.Many villages were destroyed by the fire. Moscow was covered by harmful smoke. Over 55,000 people were killed by the heat wave and the smoke in Russia.
Based on the disaster recovery theories as mentioned before in Day_92, A Okushiri town’s disaster recovery could be predicted, however, the town still has a lot of difficulties in the disaster recovery process. This was shown in Day_75.
https://disasterresearchnotes.site/archives/2921
https://disasterresearchnotes.site/archives/2753
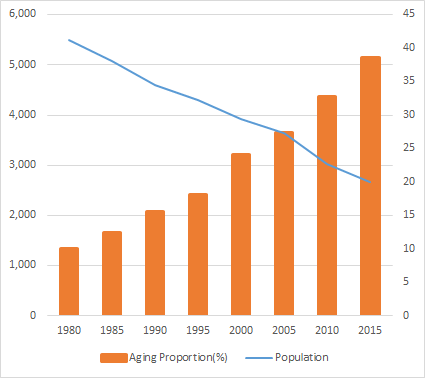
Figure 1 Demographic Changes in Okushiri Town
The 1993 southwest-off Hokkaido earthquake hit Okushiri Island severely. Casualties are 198 (including the missing number)and the economic damage indicator mentioned in the above is 0.03(Day_92). This means human suffering is relatively high however economic damage is not so high to the country. However, aid volume from outside is 14.4 percent, as the indicator, and this is so outrageously huge compared to disasters in Day_92. This can be said in the reflection of the Japanese economic situation during the time.
Okushiri town had faced population decreasing and aging issues before the disaster. After the disaster, Okushiri town had a lot of aids, especially from the inside of Japan. Japan had a very good economy at that time, so the situation enabled them to have such huge aids. Even though the large economic assistance, the town’s demographic tendency before the disaster was facilitated and faces a severe recovery process.
The population was dropped to the 2nd worst in Japanese municipalities between 2005 and 2010 after the disaster. Okushiri’s population was decreasing before and after the disaster, for example, 27.4 percent decreasing from 1990 to 2009. In addition, the population of the island had a declining tendency before the disaster and this was facilitated by the disaster. The decreasing population before the disaster can be confirmed as 5,490 in 1980 and 4,604 in 1990, this means 16 percent decrease.
The aging proportion increased two times from 1990(15.6) to 2010(32.7). The aging proportion (over 65) before the disaster was increased from 10.0 percent in 1980 to 15.6 percent in 1990. The Japanese economy was expanding at the time and a huge amount of aid was coming to the town from outside and installed, however, this Okushiri town’s case supports the recovery theory(Figure 1).
Over 20 years after the disaster, Okushiri town gives us a lot of lessons. The followings are the points that we can learn from the lessons to build a resilient society in demographic challenges.
1. Financial aids allocations: balancing soft and hard countermeasures
2. A Long perspective on the disaster recovery process
Concerning the Financial aids allocations, a huge amount of financial assistance rushed to the town, however, the assistance went to the infrastructures, building houses, purchasing fishermen’s ships, and so on to help the people’s lives in the town after the disaster. This shows more emphasis on the reconstruction than the recovery.
With respect to the recovery process, they tend to miss a long perspective. The people in the town could rebuild their houses and purchase new fishermen’s ships. Infrastructures are also rebuilt after the disaster. However, they have had not so attractive industries which the younger generation would like to work and remain in the town to live their lives. The Okushiri becomes high resistance against the disasters town, however, the population is decreasing and aging is facilitating dramatically. This means not so high resilient town. In addition, the cost of infrastructure maintenance will be a burden for the town in the long run.