Lessons」カテゴリーアーカイブ

Day_166: Interview Report: Hurricane Katrina Response (3)

>>>>>>>>>>>>>>>>>>>>>>>>>>>>
Date and time
7 May 2006

Visit
New Orleans Homeland Security and Public Safety Office
(New Orleans City Office of Homeland Security and Public Safety )

Interviewee
Colonel and Director

Subject
Hurricane Katrina Disaster Response
>>>>>>>>>>>>>>>>>>>>>>>>>>>>>>>

https://disasterresearchnotes.site/archives/3002

There are three drainage canals in New Orleans. There is also a pump station for each. Since New Orleans is below sea level, water is constantly pumped from these pump stations and drained into Lake Pontchartrain.

The breakwater was corrupted by the storm surge. The water was flowing into the canal from the lake, and at the same time, the pump station had the maximum pressure with the water. The pumps were broken and became not-functioned.

After the hurricane, there was only one evacuation route that crossed the bridge over Mississippi. However, the route had been blocked. These also affected support activities.

<Measures for breakwater>
At present, the Corps of Engineers will set a lock at the entrance of the canal and close them to prevent water from flowing into the canal since this year.

The challenge from this year is the evacuation of West Bank citizens. Because the levees are weak, hurricanes can easily break them.

The levee can be effective this year, but the problem is that in the next two years, the pump station will have insufficient capacity to pump water.

< Future measures of the city >
The following three goals are set as future measures. First, leave no one in the shelter. Second, the city will assist those who have no access to evacuation. Third, improve the safety of city facilities and property before and after the disaster.

Another important point this year is to let all citizens evacuate two days before Hurricane hit. The challenge is the reality that many people would not try to evacuate. As a background, the levee is to be broken, needs to have a terrible situation imagination.

There is a plan to install floodgates in a wide range of wetlands in eastern New Orleans to prevent storm surges.

Political challenge, New Orleans, including the peripheral has originally 100 million people, was an energy supply base, there is a tremendous national influence, the people here have to work.

As a countermeasure, the city has provided a wireless system. The system had been unavailable after the Hurricane.

A radio station in City Hall as a countermeasure against rumors which had become a social issue during Katrina was set up to keep media members staying and unifying the correct information.

Related information

The NIED team went to New Orleans and Missippi coastal areas to investigate.
Characteristics of the 2005 Hurricane Katrina Disasters

The community data center is the best to investigate to grasp the trend by using stats.

https://disasterresearchnotes.site/archives/2975

Day_164 : Development Environment Disaster Cycle Model

As mentioned before in Day_56, it is clear the model, development-environment-disaster cycle model is an analyzer that can be considered in a wide range of areas. In other words, this analysis perspective raises the sociological position of natural disasters, and the stepping stone of their historical and geographical connections become clearer. We believe that it will even be possible to provide various perspectives to prevent it from being guided.

https://disasterresearchnotes.site/archives/2598

Analytical Viewing Angle by Causal Cycle Model: Case of Isewan Typhoon Disaster and Indian Ocean Tsunami Disaster

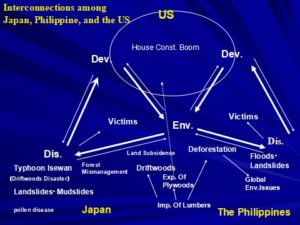
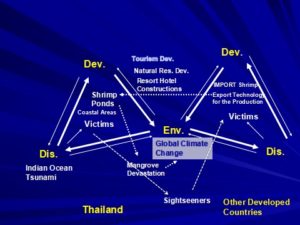
In this section, Isewan typhoon disaster and Indian Ocean tsunami disaster are specifically analyzed using the analysis view angle, the causal cycle model of development, environment, and disaster. The first is the Isewan Typhoon that hit Nagoya on September 26, 1959. The disaster was a turning point of disaster management in postwar Japan, but focusing on driftwood damage, which is one of the important aspects of the disaster, the economic recovery of postwar Japan, trade with the United States, and Japan. Forest management, natural disasters such as landslides, the problem of hay fever, which is also called national illness, and the inter-relationship between deforestation and natural disasters in the Philippines, which becomes today, will become clear. Second, regarding the Indian Ocean Tsunami that caused enormous damage on December 26, 2004, mainly in the countries around the Indian Ocean, the damage in Thailand will be analyzed. This analysis reveals the development-environment-disaster in Thailand and its relationship with Japan and Western countries.

The figures are shown as follows:

Figure 1: Interconnections of Typhoon Isewan Disaster

Figure 2: Interconnections of Indian Ocean Tsunami Disasters in Thailand

sponsored link

Day_142 : World Disaster Chronology-1994-1995


Date Place Disaster Type Situations
1994.01.17 US, Southeastern Inland Earthquake 1994 Northridge earthquake *
M6.8, 60(D), one of the costliest natural disasters of US history
1994.02.15 Indonesia, West (Sumatra Island) Inland Earthquake M6.6~7.0, Over 200(DM)
1994.05- Bangladesh Cyclone Over 170 (DM)
1994.05.13 Afghanistan Inland Earthquake M6.0, Over160(DM)
1994.06- India / Pakistan Heat Wave Over 400 (D)
1994.06- Ethiopia Drought Over 5,000(D), Food shortage
1994.06- China, Central eastern Heavy Rain, Flood Over 700(DM), A part of Shanghai was inundated
1994.06.02 Indonesia, South (Java Island) Submarine Earthquake M7.8、死不270以上、津波。
1994.06.06 Colombia, South Inland Earthquake M6.6, 300-800(DM), Debris flow
1994.06.09 Bolivia, Peru Deep-focus Earthquake 1994 Bolivia earthquake M8.2 10(D)
1994.07- Rwanda Heat Wave Over 10,000(D), combined with Civil War
1994.08.18 Algeria, North Inland Earthquake M5.7, Over 150(DM)
1994.10.04 Japan, Kunashiri Island Submarine Earthquake The 1994 Hokkaido Toho Oki Earthquake M8.2-8.3, 15(DM), Tsunami
1994.11- India South Cyclone 190(DM)
1994.11.14 The Philippines Inland Earthquake M7.1 Over70(DM) Tsunami
1994.11- Italy Heavy Rain, Flood Over 60(DM)
1994.11- Egypt Lightning 560(DM) Lightning damage to Oil facilities
1994.11- Haiti, Cuba Hurricane, Flood Over 700(DM)
1995.01.17 Japan Inland Earthquake The 1995 Great Hanshin Awaji Earthquake * M6.9~7.3 5,500~6,400(DM)
1995.03- Afghanistan Heavy Rain, Flood, Landslide Over 360(DM)
1995.04- Bangladesh Strong Wind 700(DM)
1995.05.27 Sakhalin, North Inland Earthquake The 1995 Neftegorsk earthquake,M7.1~7.5, Over 1,989(DM) Neftegorsk city was destroyed and vanished from the map after the disaster
1995.05- Brazil Heavy rain, Flood. Landslide Over 80(DM)
1995.05- China Heavy rain, Flood Over 1,100(DM), Yangtze river flood
1995.06- India, Pakistan Heat Wave Over 800(D)
1995.06- Japan Heavy rain, Flood 9(DM), Destroyed Approx.200, Inundated over15,000
1995.07- US Heat Wave Over 800(D)
1995.07- D.P.R.Korea Heavy rain, Flood Over 60(DM)
1995.07- Thailand Heavy rain, Flood Over 200(DM)
1995.08- Morocco Heavy rain, Flood Over 150(DM)
1995.9- The Philippines Heavy rain, Flood Over 540(DM)
1995.11- The Philippines Typhoon, Flood Over 780(DM)
1995.12-  Kazakhstan Cold Wave Over 100(DM) Snowstorm

D: The number of Death M: Missing number DM: The dead and missing number

https://disasterresearchnotes.site/archives/2831

Related articles across the web

Day_140 : Natural Disasters in Europe (2) Vajont Dam Collapse


europe-pic
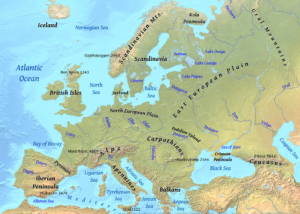
Figure   The Europe

Concerning hydrological, meteorological, and climatological disasters, heavy rain and storm disasters are caused by low  pressure in the Icelandic area developed in the winter season. A cold atmospheric current coming from Arctic gains a warmer vapor stream from the Gulf Stream and develops a strong atmospheric depression in the area. This causes the strong winds and high tidal waves along the coastal areas of the North Sea. Netherlands and England can be highlighted. The Netherlands had storm surges in 1530 and 1570. The death tolls were approximately 400,000 (1530) and 70,000 (1570) for each. The 1953 depression took 1800 deaths. This disaster also reached England. England’s disasters were the 1703 Thames river flood and the 2003 Heatwave. The temperature was 8–10 over an average year in August 2003 (Day 38).

Danube, Elbe, Rhine, and Seine rivers are on a gentle slope, causing slow inundations caused by heavy rains. On August 2, 2002, Central Europe had heavy rain, which caused the Danube and Elbe rivers to overflow in Germany, Czech Republic, Austria, and Hungary. The death toll is approximately 100; the number of people affected is over 100,000. Historical buildings in the city, such as Prague,Dresden, and so on, along the rivers, were also inundated.

The Alps  have had landslides, debris flows, slope failures, and so on. The particular example is the landslide in the Dolomites, North Italy, in 1963. Overflows from Vajont dam caused by a large-scale landslide attacked the village in downstream areas. The death toll is approximately 2600.

A brief explanation


An interview-based explanation

On August 2003, West Europe had 8–10 degrees celsius higher than the average. This heat wave killed 15000 in France, 7000 in Germany, 4000 in Spain, 4000 in Italy, and so on, for a total of 35000.

In summer 2010, Russia had a heat wave and this makes wildfire. The wildfire was spread out and it took over 1.5 months to extinguish.Many villages were destroyed by the fire. Moscow was covered by harmful smoke. Over 55,000 people were killed by the heat wave and the smoke in Russia.

To be continued…

Day_139(Rev) : A Disaster Recovery in an Aging Society : An Okushiri Town’s Case


Based on the disaster recovery theories as mentioned before in Day_92, A Okushiri town’s disaster recovery could be predicted, however, the town still has a lot of difficulties in the disaster recovery process. This was shown in Day_75.

https://disasterresearchnotes.site/archives/2921


https://disasterresearchnotes.site/archives/2753


okushiri-recov

Figure 1 Demographic Changes in Okushiri Town

The 1993 southwest-off Hokkaido earthquake hit Okushiri Island severely. Casualties are 198 (including the missing number)and the economic damage indicator mentioned in the above is 0.03(Day_92). This means human suffering is relatively high however economic damage is not so high to the country. However, aid volume from outside is 14.4 percent, as the indicator, and this is so outrageously huge compared to disasters in Day_92. This can be said in the reflection of the Japanese economic situation during the time.

Okushiri town had faced population decreasing and aging issues before the disaster. After the disaster, Okushiri town had a lot of aids, especially from the inside of Japan. Japan had a very good economy at that time, so the situation enabled them to have such huge aids. Even though the large economic assistance, the town’s demographic tendency before the disaster was facilitated and faces a severe recovery process.

The population was dropped to the 2nd worst in Japanese municipalities between 2005 and 2010 after the disaster. Okushiri’s population was decreasing before and after the disaster, for example, 27.4 percent decreasing from 1990 to 2009. In addition, the population of the island had a declining tendency before the disaster and this was facilitated by the disaster. The decreasing population before the disaster can be confirmed as 5,490 in 1980 and 4,604 in 1990, this means 16 percent decrease.

The aging proportion increased two times from 1990(15.6) to 2010(32.7). The aging proportion (over 65) before the disaster was increased from 10.0 percent in 1980 to 15.6 percent in 1990. The Japanese economy was expanding at the time and a huge amount of aid was coming to the town from outside and installed, however, this Okushiri town’s case supports the recovery theory(Figure 1).

Over 20 years after the disaster, Okushiri town gives us a lot of lessons. The followings are the points that we can learn from the lessons to build a resilient society in demographic challenges.

1. Financial aids allocations: balancing soft and hard countermeasures
2. A Long perspective on the disaster recovery process

Concerning the Financial aids allocations, a huge amount of financial assistance rushed to the town, however, the assistance went to the infrastructures, building houses, purchasing fishermen’s ships, and so on to help the people’s lives in the town after the disaster. This shows more emphasis on the reconstruction than the recovery.

With respect to the recovery process, they tend to miss a long perspective. The people in the town could rebuild their houses and purchase new fishermen’s ships. Infrastructures are also rebuilt after the disaster. However, they have had not so attractive industries which the younger generation would like to work and remain in the town to live their lives. The Okushiri becomes high resistance against the disasters town, however, the population is decreasing and aging is facilitating dramatically. This means not so high resilient town. In addition, the cost of infrastructure maintenance will be a burden for the town in the long run.

To be continued……

# This post will be partly published as a paper.

Day_136 : Disaster-Related Death (1)

Kobe Earthquake : 919 (22Dec.2015)
Great East Japan Earthquake and Tsunami : 3,472 (31Mar.2016)

What are the numbers?

The above numbers are the numbers of disaster-related deaths. The disaster-related death means the death which is not directly caused by hazards such as sickness, disease, and committing suicide. Especially , the disaster-related death number of GEJET is still increasing even 5 years after the disaster. This reflects aging society. The elderly people tends to have sickness and losing hope without family members. Local governments have been working hard to prevent such tragedies. They are visiting and watching the victims individually.

Day_131 : Italy-Recent earthquake and past earthquake disasters (2)

CNN: (October 30)A powerful 6.6-magnitude earthquake rocked central Italy on Sunday morning, injuring at least 20 people, in the strongest tremor to hit the country in more than three decades. The earthquake follows tremors last week and comes on the heels of a devastating quake in August, which killed nearly 300 people and flattened entire villages.

Asian Disaster Reduction Center (ADRC) still does not list this earthquake situation.This earthquake is severer than this August Earthquake(Day_107). Earthquakes in Italy happened mostly central and southern part of Italy around the

http://disasters.weblike.jp/disasters/archives/3081

Natural disaster trends are usually from human sufferings to economic damage. In Italy, main natural disaster is the earthquake and follow the trends as you can confirm below.
However, recent earthquake disasters in Italy are so severe.  With this August earthquake, the number of casualties would be over 550. The disaster recovery is also the issue. As mentioned in Day_107, “Italy has a poor record of rebuilding after quakes. About 8,300 people who were forced to leave their houses after a deadly earthquake in L’Aquila in 2009 are still living in temporary accommodation(Reuters).”

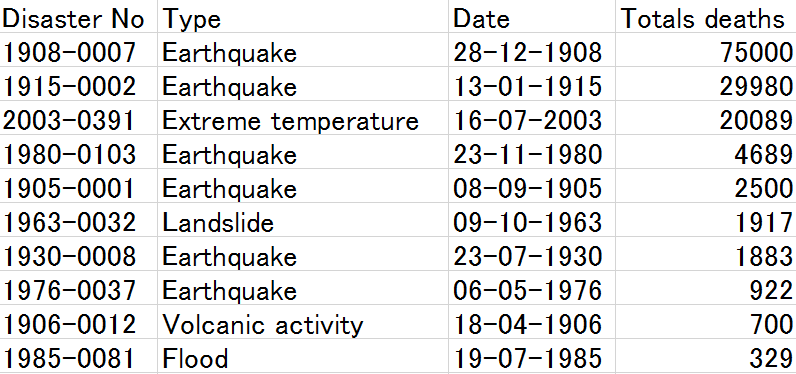
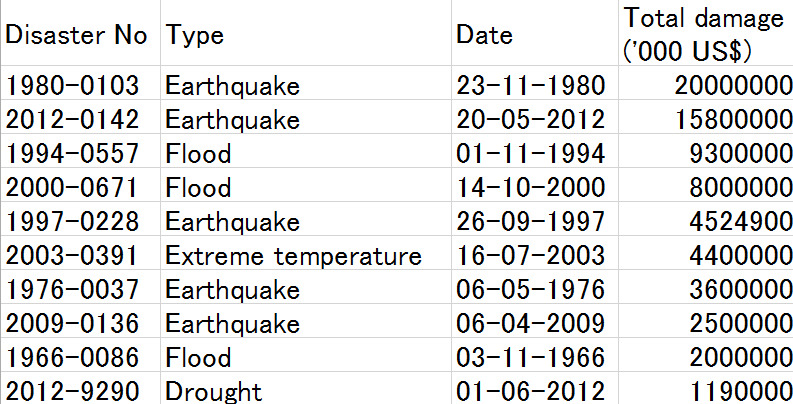
Table 1 and Table 2 show the 1900-2016 top 10 deadliest and costliest disasters in Italy (EM-DAT).

Table 1  Totals deaths
Italy deadliest

Table 2  Total damage
Italy costliest disasters

Day_127 : World Disaster Chronology-1990-91

Date Place Disaster Type Situations
1990.01- Indonesia Heavy Rain, Flood Over 130(DM)
1990.03- Bangladesh Heavy Rain, Flood 170(DM)
1990.04- Africa, East Heavy Rain, Flood Over 140(DM)
1990.04.26 China, Qinghai Inland Earthquake M6.5, Over 120(DM) Landslide
1990.05- India Cyclone, Flood Over 3,000(DM)
1990.05.29 Peru, Central Inland Earthquake M6.5,130-200 (DM),Landslide
1990.06- Japan, Kyushu Heavy Rain, Flood 27(DM),Injured 80, Destroyed approx.500, Inundated over 42,000
1990.06.21 Iran, North Inland Earthquake 1990 Manjil–Rudbar earthquake*1),M7.3-7.7, 30,000-50,000(DM), destroyed several towns 
1990.07.16 The Philippines, Luzon Inland Earthquake 1990 Luzon earthquake*2), (M7.8),
1,700-2,400 (DM)
1990.08- China Heavy Rain, Flood Over 300(DM)
1990.08- The Philippines Typhoon, Flood 230(DM)
1990.09- Korea Heavy Rain, Flood Over 130(DM)
1990.09- Japan, Northeast Typhoon, Flood 40(DM), Injured 130, Destroyed approx.16,000, Inundation Over18,000
1990.10- Bangladesh Cyclone, Flood Over 3,000(DM)
1990.11- Tha Philippines Typhoon, Flood Over 350(DM)
1991.02.01 Afganistan Inland Earthquake M6.4,200-700(DM)
1991.04.22 Costa Rica Inland Earthquake M7.6, 70(D) with Panama
1991.04.29 USSR(Georgia) Inland Earthquake M7.0, Over100(DM)
1991.04- Bangladesh Cyclone, Flood 1991 Bangladesh cyclone*3), Over 139,000(DM). This disaster was among the deadliest tropical cyclones on record. 
1991.06- Japan, Kyushu Volcanic eruption Mt.Unzen Volcanic eruption*4),Pyroclastic flow,Over 40(D)
1991.06- The Philippines, Luzon Volcanic eruption Mt. Pinatubo Volcano eruption*5), 700-1000(DM)
1991.06- Pakistan Heat wave Over 300(DM)
1991.06- China Heavy rain, Flood Over 400(DM)
1991.07- India Heavy rain, Flood Over 900(DM)
1991.07- China Typhoon,Flood 200(DM)
1991.08- Korea Typhoon,Flood 100(DM)
1991.09- China Landslide Over 270(DM)
1991.09- Japan, all areas Typhoon,Flood 1991 Typhoon No.19, 62(DM)*6), Injured1,500, Destroyed approx.170,000, Inundation over 22,000
1991.10.20 India, North Inland Earthquake M6.8-7.0, 7702,000(DM)
1991.11- The Philippines, Central Typhoon, Flood Over 6,300(DM)*7)
1992.01- Bangladesh Cold Wave Over130(DM)

DM: The number of dead and missing.

1) Iran is one of the most vulnerable country on earthquake disasters.
The below Day_81 can be checked.
2) Buguio city was severely hit by this earthquake. The city is also vulnerable to landslide disasters. 2009 Typhoon Pepeng hit the Buguio city. There were some issues in this city. Urbanization is the one of the causes.
NIED natural disaster research report
3) Some past posts can be referred. The below Day_117 can be checked.
4) Some past posts can be referred.The below Day_65 can be checked.
5) A huge cloud of volcanic ash and gas rises above Mount Pinatubo, Philippines, on June 12, 1991. Three days later, the volcano exploded in the second-largest volcanic eruption on Earth in this century.Following this Mount Pinatubo’s cataclysmic June 15, 1991, eruption, thousands of roofs collapsed under the weight of ash made wet by heavy rains (see example in photo above). Ash deposits from the eruption have also been remobilized by monsoon and typhoon rains to form giant mudflows of volcanic materials (lahars), which have caused more destruction than the eruption itself(http://pubs.usgs.gov/fs/1997/fs113-97/).
6) Itsukushima Shrine, its complex is listed as a UNESCO World Heritage Site, was damaged.
7) The Ormoc region was inundated by Tropical Storm Uring.The city government recorded 4,922 deaths, 3,000 missing persons, 14,000 destroyed houses. We call this disaster “Ormoc Tragedy”

http://disasterresearchnotes.site/archives/2801

http://disasterresearchnotes.site/archives/3224


https://disasterresearchnotes.site/archives/2679


Day_124 : Chain Reactions of Economic Damage- 2011 Chao Phraya River Flood in Thailand (3) Horizontal and Vertical Damage Exacerbations

Continue to explain the chain reactions of economic damage caused by Chao Phraya river flood. There were horizontal and vertical damage exacerbations types.

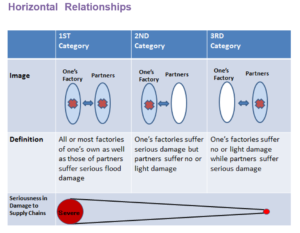
Concerning the horizontal damage exacerbations, we sometimes neglect indirect severe impacts caused by disasters. However, in this global world, economic activities are connected each other and so do the impacts. The following Figure 1 shows the three types of disaster exacerbations for example. The first category is “All or most factories of one’s own as well as those of partners suffer serious flood damage”. This category is the severest. The second category is “One’s factories suffer serious damage, but partners suffer no or light damage”. The third category is “One’s factories suffer no or light damage while partners suffer serious damage”. However, if the one’s factory totally relies on the partners which are affected by the disaster could have a very serious impact.

supply_holizontal
Figure 1  Damage types and severities (Horizontal)

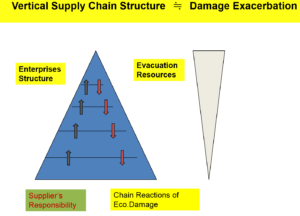
With respect to the vertical damage exacerbation, the key word is the suppliers’ responsibility. For example, a big major car company has the responsibility for customers to supply cars, subcontractors have the responsibility for the car company to supply the parts,  sub-subcontractors have the responsibility for the subcontractors to supply the parts of the parts, sub-sub-subcontractors have the responsibility for the sub-subcontractors to supply the parts of the parts of the parts, and so on. The numbers of the companies become larger along with this vertical pyramidal structure. However, their resources are opposite as mentioned in Figure 2. Industrial estates and parks ordered the evacuation for the companies very slowly at that time of the flood because of some reasons (The reasons will be explained). However, the big companies continued their activities until the time, so sub and sub-sub and sub-sub-sub contractors could not evacuate until the bigger (upstream) companies’ evacuation decision making because of the supplier’s responsibilities. The big companies could evacuate so fast and effectively. They have the resources to do so. However, smaller companies could not evacuate so fast because they needed to wait until the bigger company’s evacuation decision and they tended to have limited resources along with the structure. They, for instance, could not move heavy machines to the upper floors. They did not have enough employees, systems, or plans to do so.

supply_vertical
Figure 2  Damage types and severities (Vertical)

These are the outlines of the disaster damage exacerbation of the supply chains.  These are presented at several meetings in Japan.

Day_122 : Japanese Disaster History after the Second World War (2)

Japanese disaster history has three turning points. The first is the Typhoon Isewan (Vera) in 1959. The second is the Kobe earthquake disaster in 1995, the third is the Great East Japan Earthquake and Tsunami (GEJET) disaster in 2011(Day_33).

https://disasterresearchnotes.site/archives/2439

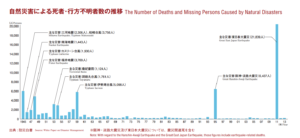
You can see the following figure 1 which displays the dead and missing numbers caused by natural disasters in Japan.

deathtollafterww2
Figure 1 The dead and missing numbers caused by natural disasters in Japan

After the second world war, Japan was vulnerable, so we had a lot of natural disasters, especially Typhoon disasters from 1945 to 1959. We call this 15 years a great flood and storm era. The first hit was Typhoon Makurazaki on Sep. 1945.The typhoon disrupted Hiroshima city. There were 1229 casualties in the city. This fact reminds us what happened in Hiroshima in the same year (Day_34(Re)).

https://disasterresearchnotes.site/archives/2866

The Isewan Typhoon has the following aspects: 1) Physical damages were tremendous 2) Lack of consideration of disaster prevention 3) Inadequate flood defense system 4) Inadequate warning and evacuation system ( The details will be explained later) After the Typhoon Isewan, disaster countermeasures basic act was enacted in 1961. The act combined many disasters related laws into one. After the Isewan Typhoon, we Japanese had thought we were successfully mitigating natural disasters.  You can see the dead and missing numbers were dropped right after the Isewan Typhoon by Figure 1.  This is mainly because of infrastructures and the development of science and technologies such as warning systems along with Japanese rapid economic growth. In addition, we had, fortunately, no huge natural hazards until the Kobe earthquake in 1995.

After the period of1960-1994, we have faced the Kobe Earthquake in 1995. Then, we realized that we could not prevent natural disasters, however, we could mitigate natural disasters after the earthquake. We also learned the importance of soft countermeasures as well as hard countermeasures. The Japanese Government had changed the policies again. The Kobe earthquake facilitated volunteer activities. Many social scientists started to investigate disasters. Before the disaster, natural scientists and engineers are the main players to do disaster-related research along with Japanese infrastructure centered policies. After that, we had confidence again and we thought we could be a model for other countries. The World Conference on Disaster Reduction was held in Kobe in 2005. Kobe city tried to be a center of world disaster-related organizations. (This Kobe earthquake disaster will be explained later)

However, we faced the Great East Japan Earthquake and Tsunami (GEJET) disaster in 2011. The GEJET disaster became the worst ever disaster in Japan after the second world war. The GEJET broke the Japanese confidence again and reconsider our strategies.

To be continued

*Disaster countermeasures basic act:
http://www.preventionweb.net/english/policies/v.php?id=30940&cid=87

sponsored link