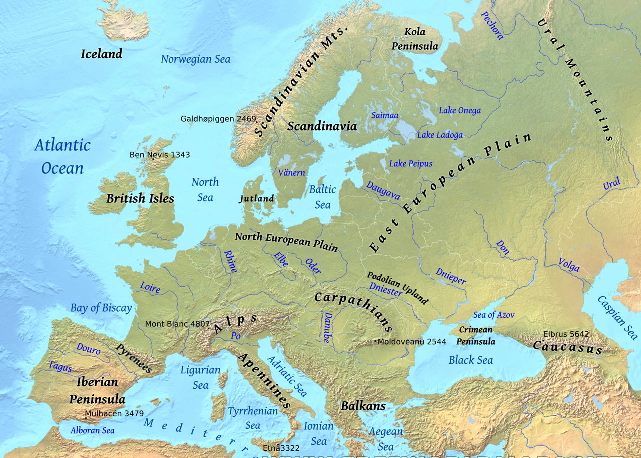
Flood」カテゴリーアーカイブ

Day_140 : Natural Disasters in Europe (2) Vajont Dam Collapse


europe-pic
Figure   The Europe

Concerning hydrological, meteorological, and climatological disasters, heavy rain and storm disasters are caused by low  pressure in the Icelandic area developed in the winter season. A cold atmospheric current coming from Arctic gains a warmer vapor stream from the Gulf Stream and develops a strong atmospheric depression in the area. This causes the strong winds and high tidal waves along the coastal areas of the North Sea. Netherlands and England can be highlighted. The Netherlands had storm surges in 1530 and 1570. The death tolls were approximately 400,000 (1530) and 70,000 (1570) for each. The 1953 depression took 1800 deaths. This disaster also reached England. England’s disasters were the 1703 Thames river flood and the 2003 Heatwave. The temperature was 8–10 over an average year in August 2003 (Day 38).

Danube, Elbe, Rhine, and Seine rivers are on a gentle slope, causing slow inundations caused by heavy rains. On August 2, 2002, Central Europe had heavy rain, which caused the Danube and Elbe rivers to overflow in Germany, Czech Republic, Austria, and Hungary. The death toll is approximately 100; the number of people affected is over 100,000. Historical buildings in the city, such as Prague,Dresden, and so on, along the rivers, were also inundated.

The Alps  have had landslides, debris flows, slope failures, and so on. The particular example is the landslide in the Dolomites, North Italy, in 1963. Overflows from Vajont dam caused by a large-scale landslide attacked the village in downstream areas. The death toll is approximately 2600.

A brief explanation


An interview-based explanation

On August 2003, West Europe had 8–10 degrees celsius higher than the average. This heat wave killed 15000 in France, 7000 in Germany, 4000 in Spain, 4000 in Italy, and so on, for a total of 35000.

In summer 2010, Russia had a heat wave and this makes wildfire. The wildfire was spread out and it took over 1.5 months to extinguish.Many villages were destroyed by the fire. Moscow was covered by harmful smoke. Over 55,000 people were killed by the heat wave and the smoke in Russia.

To be continued…

Day_125 : Shingen(-Zutsumi) Embarkment (2)

Those who can rule the water can also rule the country. This proverb became a reality, especially during the Sengoku period (Warring States Period) in Japan.

https://disasterresearchnotes.site/archives/2837

Shingen(-Zutsumi) embankment is a flood control system which was built over 400 years ago to protect the northern part of the Kofu Basin, the rich rice paddy areas of Kai Province. The name comes from the Daimyo (District Lord) Shingen Takeda. Shingen Takeda was one of the strongest Samurai Daimyo during the period. He controlled his soldiers well and so the floods.

shingen
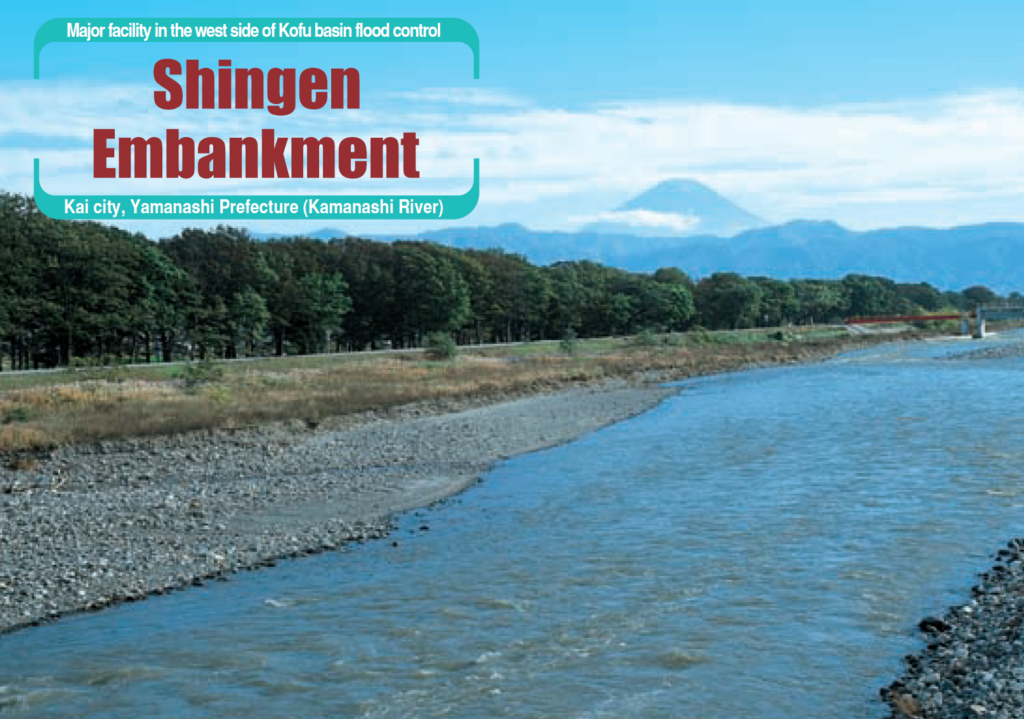
Figure: Shingen Embarkment**

In addition to Shingen-Zutsumi Embankment, there are also Bunroku-Zutsumi and Taiko-Zutsumi Embankments established by Shogun (Hideyoshi Toyotomi). The Circle Levee in Nobi Plain is also called that it was built during the time. However, there are still arguments that Samurai Daimyo could built such embankments or not because they required high technologies and a huge amount of human resources during the periods.

To be continued……

**Brochure (Information about Fuji river Flood Control)

Day_124 : Chain Reactions of Economic Damage- 2011 Chao Phraya River Flood in Thailand (3) Horizontal and Vertical Damage Exacerbations

Continue to explain the chain reactions of economic damage caused by Chao Phraya river flood. There were horizontal and vertical damage exacerbations types.

Concerning the horizontal damage exacerbations, we sometimes neglect indirect severe impacts caused by disasters. However, in this global world, economic activities are connected each other and so do the impacts. The following Figure 1 shows the three types of disaster exacerbations for example. The first category is “All or most factories of one’s own as well as those of partners suffer serious flood damage”. This category is the severest. The second category is “One’s factories suffer serious damage, but partners suffer no or light damage”. The third category is “One’s factories suffer no or light damage while partners suffer serious damage”. However, if the one’s factory totally relies on the partners which are affected by the disaster could have a very serious impact.

supply_holizontal
Figure 1  Damage types and severities (Horizontal)

With respect to the vertical damage exacerbation, the key word is the suppliers’ responsibility. For example, a big major car company has the responsibility for customers to supply cars, subcontractors have the responsibility for the car company to supply the parts,  sub-subcontractors have the responsibility for the subcontractors to supply the parts of the parts, sub-sub-subcontractors have the responsibility for the sub-subcontractors to supply the parts of the parts of the parts, and so on. The numbers of the companies become larger along with this vertical pyramidal structure. However, their resources are opposite as mentioned in Figure 2. Industrial estates and parks ordered the evacuation for the companies very slowly at that time of the flood because of some reasons (The reasons will be explained). However, the big companies continued their activities until the time, so sub and sub-sub and sub-sub-sub contractors could not evacuate until the bigger (upstream) companies’ evacuation decision making because of the supplier’s responsibilities. The big companies could evacuate so fast and effectively. They have the resources to do so. However, smaller companies could not evacuate so fast because they needed to wait until the bigger company’s evacuation decision and they tended to have limited resources along with the structure. They, for instance, could not move heavy machines to the upper floors. They did not have enough employees, systems, or plans to do so.

supply_vertical
Figure 2  Damage types and severities (Vertical)

These are the outlines of the disaster damage exacerbation of the supply chains.  These are presented at several meetings in Japan.

Day_121 : Chain Reactions of Economic Damage- 2011 Chao Phraya River Flood in Thailand (2)

Continue the last topic.

http://disasters.weblike.jp/disasters/archives/3257

There were three inquiries to ponder as follows:
1) Why were so many foreign companies coming and making supply chains?
2) What kinds of damage types could be analyzed and how about the influences?
3) How did companies respond?

Concerning the 1) Why were so many foreign companies, especially Japanese companies coming and making supply chains? There are reasons from Thailand and Japan sides. The first, Thai national government tried to de-centralize to narrow the gaps between Bangkok and other regions because so many things concentrated in Bangkok. To do this, establishing industrial estates and parks is the one of the effective ways to mobilize the people, things, and investments from Bangkok to the regions. The national government also had set some tax incentives to motivate foreign companies to come. Thailand is the very nice place for Japanese to stay because of the education systems, medical services, abundant labor force, people’s character, safety, and so on. The second, Japan had faced the problems of the rising yen after the Plaza agreement in 1985. Big companies, especially manufacturers, which had international businesses decided to move to Thailand to produce their products. After the bankruptcy of Lehman Brothers in 2008, the world economic climate became worse and the yen’s price was getting higher and higher again. Small companies, this time, could not endure the situations and moved to Thailand to deal with the big companies which already transferred in Thailand. Again, the attached graph (Figure 4) indicates so many Japanese companies came these areas after 1985, the year of the Plaza Agreement.  A number of  the JCC (The Japanese Chamber of Commerce) BKK member reflects the situations.

japanese-companies
Figure 4  Japanese enterprises coming to Thailand

To be continued…………..

Day_120 : Chain Reactions of Economic Damage- 2011 Chao Phraya River Flood in Thailand (1)

2011 Chao Praya river flood gives us a lot of lessons. The disaster is the 7th costliest disaster worldwide since 1980 to 2014 (Figure 1).

deadliest
Figure 1  10 Costliest events

From economic damage points of views, the below is the industrial estates and parks which were affected. 7 estates and parks were inundated. 804 companies were affected and among those, 449 were Japanese related companies in these estates and parks(Figure 2).

pic_industrial-estates-and-parks
Figure 2 7 Inundated industrial estates and parks

Can show you a brief outlines of the chain reactions of economic damage caused by 2011 Chao Phraya river flood. There are three main inquiries to ponder (Figure 3) : 1) Why were so many foreign companies coming and making supply chain? 2) What kinds of damage types could be analyzed and how about the influence? 3) How did companies respond?

3questions
Figure 3  3 Research Questions (rough skech)

These will be explained later. The attached graph (Figure 4) indicates so many Japanese companies came these areas after 1985, the year of the Plaza Agreement.

japanese-companies
Figure 4  Japanese enterprises coming to Thailand

Horizontal and vertical damage exacerbations types can be shown in the following figures.

supply_holizontal
Figure 5  Damage types and severities (Horizontal)

supply_vertical
Figure 5  Damage types and severities (Vertical)

To be continued…………..

Day_103 : New Orleans and Hurricane Katrina in 2005

Day_100 indicated a human suffering exacerbation process in New Orleans during the 2005 Hurricane Katrina.

http://disasters.weblike.jp/disasters/archives/2975

The Figure 1 again shows the relationships between the human suffering exacerbation process and social backgrounds with data. Table 1 also indicates the estimated death numbers in some wards.

exacerbation2
Figure 1 Human Suffering Exacerbation Process and Social Background

Table 1 Found Dead Bodies in New Orleans

dead in neworleans

The total views are indicated in the following Figure 2, 3, 4, and Table 2.
Concerning the population change, New Orleans is the one of the decreasing communities in US. For example, rapid urbanization related matters caused environmental degradation before the disaster. Campanella(2004)mentioned New Orleans became not a sustainable, but a survival city. The lower 9th ward, for example, with regard to the ethnicity, we can see the high black and the African American proportion.  With respect to Income, we can also identify the people living in the Lower 9th ward have lower incomes.

NOLApopulation
Figure 2  Population Change Louisiana( Light Blue ) and New Orleans (Dark Blue)


2000census
Figure 3 Percent Black or African American, 2000 (Census, 2000)

pop and ethnicities
Figure 4 Percent Black or African American and White
(Source: Congressional Research Service)

Table 2 People’s Income in both New Orleans and Lower 9th Ward

income katrina

These are referred by an NIED publication.

Day_100 : A Human Suffering Exacerbation-Data from Greater New Orleans Community Data Center

The Greater New Orleans Community Data Center (GNOCDC) website was found after the field survey on Hurricane Katrina in Louisiana and Mississippi in 2005. I was so amazed. This is the one of the demographers great contributions to disaster research.

The site provides the information of the pre-Katrina situations by parish and also by ward. This is very useful to examine the social backgrounds of the areas in detail.

gnocdcPrekatrina
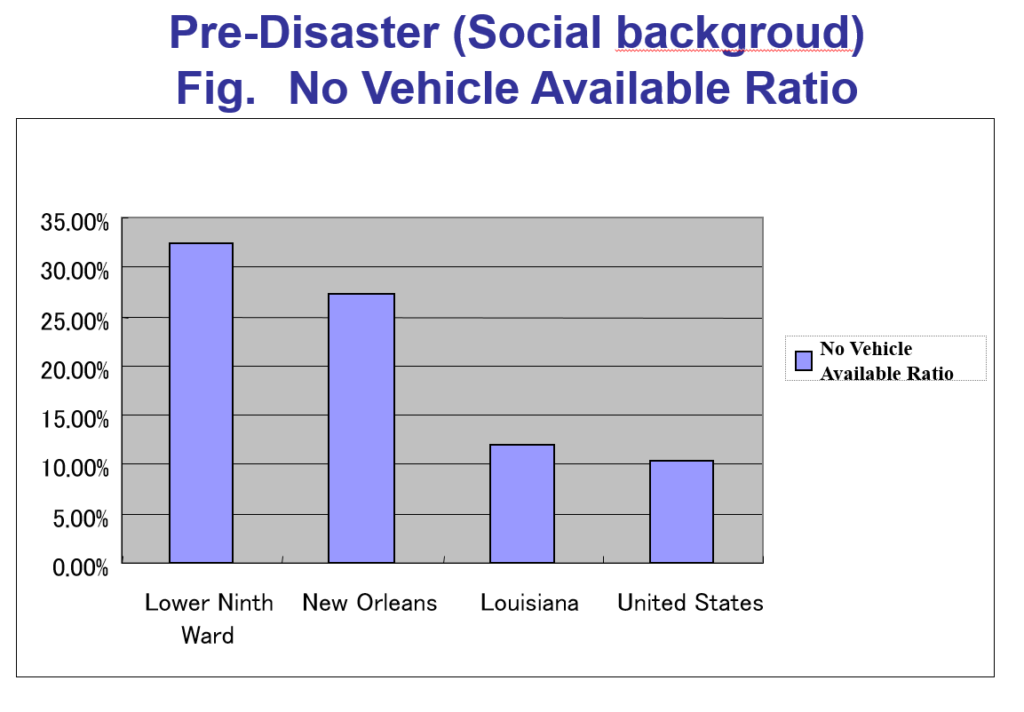
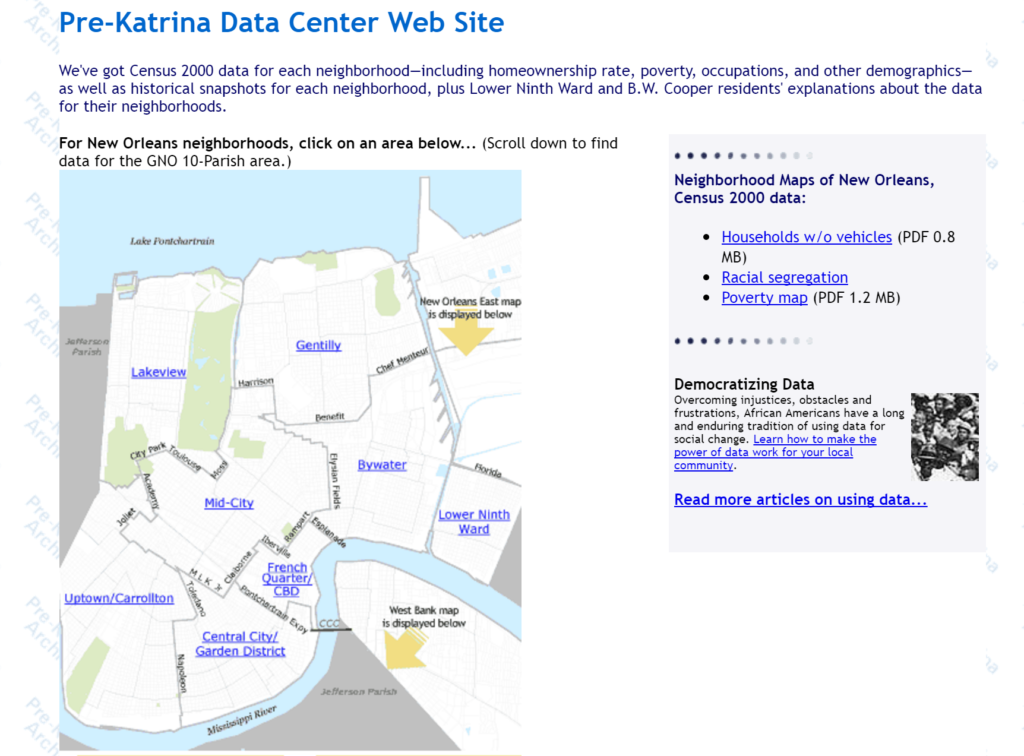
Figure 1 GNOCDC (Pre-Katrina data site)

The paper on Karina disaster using these data is to explain how human sufferings were exacerbated by the stage with the social background as shown in Figure 2 (Nakasu, 2006 :Sorry in Japanese, however, summary and figures are in English).

human suffering
Figure 2 Victimization Process

exacerbation2
Figure 3
Victimization Process by Stage

Table 1 Found Dead Bodies in New Orleans  

dead in neworleans

The process can be divided into five stages with time such as A) Pre-disaster B) Direct damage C) Social disorder D) Life environment  E) Reconstruction and recovery. Then, these are examined with the social background data (Figure 3).

For example,  1) Pre-disaster stage, I picked up an evacuation aspect to explain the social background of this stage.

Using the GNOCDC database, I could check the possession ratio of the vehicle in some areas.

novehicle
Figure 4 No Vehicle Available Ratio (GNOCDC)

Table 1 and Figure 4 show the people in Lower 9th ward, one of the most severely affected areas, had a low possession ratio of the vehicle. This can explain so many residents needed to have government help to evacuate and they could not evacuate before the Hurricane hit.

The general social background, such as ethnic groups, household incomes, and others with other stages of examinations will be discussed later.


The Great Deluge: Hurricane Katrina, New Orleans, and the Mississippi Gulf Coast (English Edition)

Day_97 : World Disaster Chronology 1976 (2)


Date Place Disaster Type Situations
1976.08.17 The Phillipines, South
Mindanao
Submarine earthquake 1976 Moro Gulf earthquake and tsunami*: M7.8-8.1,A dead and missing number is 4,000-8,000
1976.09- Japan Typhoon 1976 Typhoon No.17 Flood (Nagara river flood
A dead and missing number is 169, Injured 400
1976.10.28- Japan, North-eastern Strong wind Sakata conflagration: A death and missing 2, Injured over 900
1976.10.29 Indonesia, East Irian Jaya Inland earthquake M7.2, A death and missing number is 100-6,000not confirmed),landslide
976.11.24 Turkey and Iran border Inland earthquake  1976 Çaldıran–Muradiye earthquake**: M7.2-7.6, A death and missing number is 3,600-10,000
1976.12- Japan Snow  A death and missing number is 84, Injured over300, damage loss 40 billion yen

1976 Moro Gulf earthquake and tsunami*
The worst tsunami disaster in the Philippines.1) It happened while most people were sleeping.
2) No warning after the earthquake.

1976 Çaldıran–Muradiye earthquake**
The almost all houses were destroyed because of the structure constructed of thick walls made from rubble masonry cemented with mud mortar.

[ad#ads1]

Day_80 : The Metropolitan Area Outer Underground Discharge Channel

The Metropolitan area around Tokyo had suffered flood disasters with the rapidly growing population and urbanizations after the second world war. Because of this situation, the “Metropolitan Area Outer Underground Discharge Channel” was established. This flood defense system is really really great. I recommend you to watch this with your own eyes when you have an opportunity to visit the metropolitan area around Tokyo in Japan. You can see like an underground temple shrine sanctuary.

You can see that by the following video:

[ad#ads1]