
Disaster Research Notes YouTube channel has just started.
Day_195 : Scientists and Disaster Management Controversy issues with a L’Aquila Earthquake Case
The L’Aquila earthquake, which struck the Abruzzo region of Italy on April 6, 2009, was a significant case study for both scientists and disaster risk management professionals for several reasons. With a magnitude of 6.3, this earthquake caused extensive damage to the medieval city of L’Aquila, resulting in the deaths of more than 300 people, injuring over a thousand, and leaving tens of thousands of people homeless. Beyond the immediate physical damage and tragic loss of life, the L’Aquila earthquake raised important issues related to earthquake prediction, risk communication, and the responsibilities of scientists and authorities in disaster risk management.
Scientific Aspects and Controversies
The occurrence of earthquakes sparked a controversial debate over the ability to predict earthquakes and the communication of seismic risks to the public. Before the earthquake, a series of tremors were felt in the region, leading to heightened public concern. A week before the major earthquake, a meeting of the Major Risks Committee, which included government officials and scientists, was held to assess the situation. The committee concluded that it was not possible to predict whether a stronger earthquake would occur but reassured the public, suggesting a low likelihood of a major event. Unfortunately, the devastating earthquake struck shortly thereafter.
This situation has led to significant controversy, particularly regarding the role and communication strategies of scientists and government officials in disaster risk management. Critics argued that reassurances were misleading and contributed to a false sense of security among the population.
Legal and Ethical Issues
In a highly controversial decision, six Italian scientists and one government official were initially found guilty of manslaughter in 2012 for underestimating the risks and failing to adequately warn the population. This verdict was widely criticized by the international scientific community, which argued that it was unreasonable to expect scientists to accurately predict earthquakes. The verdict was largely overturned in 2014, with the convictions of scientists being annulled and the sentence of the government official being reduced.
Disaster Risk Management Implications
The L’Aquila earthquake underscored the importance of effective disaster-risk management and communication strategies. Key lessons include:
- Communication of Uncertainty: It highlighted the need for clear communication of scientific uncertainty to the public. Conveying the inherent uncertainties in earthquake prediction is crucial for helping individuals and communities make informed decisions about risk reduction and preparedness.
- Public Education and Preparedness: The tragedy reinforced the need for ongoing public education on disaster preparedness and the importance of building earthquake-resilient communities.
- Building Codes and Urban Planning: Ensuring strict adherence to earthquake-resistant building codes and urban planning practices is vital in reducing the vulnerability of buildings and infrastructure.
- Multi-disciplinary Approach: The event demonstrated the importance of a multi-disciplinary approach that includes not only seismologists but also engineers, urban planners, emergency management professionals, and policymakers in disaster risk management planning and response.
- Ethical Responsibilities: The aftermath raised questions about the ethical responsibilities of scientists and the balance between preventing public panic and ensuring preparedness.
The L’Aquila earthquake remains a case study of the complex interplay among science, policy, ethics, and public communication in the context of natural disaster risk management.
Day_85 : Shingen Embarkment: SAMURAI Disaster Risk Management
Those who can rule the water can also rule the country. This proverb became a reality, especially during the Sengoku period (Warring States Period) in Japan.
Shingen embankment was a flood control system built over 400 years ago to protect the northern part of the Kofu Basin, the rich rice paddy areas of Kai Province, then under the rule of Daimyo (District Lord) Shingen Takeda. The main problem is that the Midai River, a left branch of the Kamanashi River, is the major branch of the Fuji River, Once the Midai River flow increases and broke the bank protecting the Kofu Basin at its confluence with the Kamanashi River, the flood damage to the paddy fields was extensive. Such floods were known even in prehistoric times. Towards AD 1500, Shingen Takeda, the Daimyo (District Lord) of Kai country, directed that flood control works be made to protect the rice paddy area of his country (Takeuchi, 2003*).
Shingen Takeda was one of the strongest Samurai Daimyo (District Lord). He controlled his soldiers well and so did the floods.
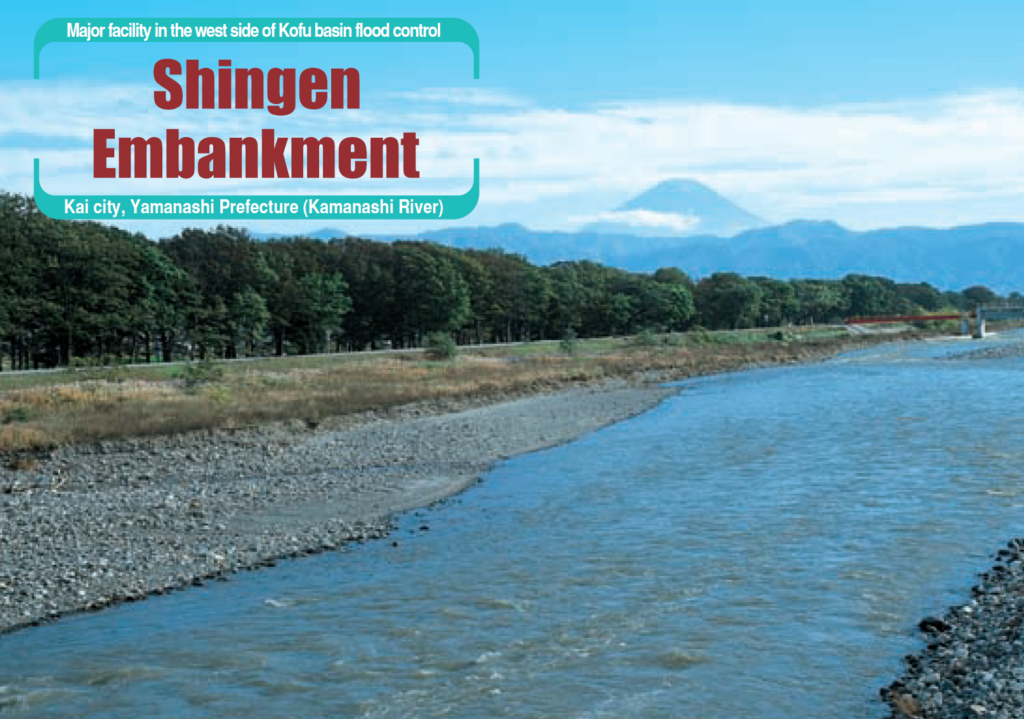 Figure: Shingen Embarkment**
*The Basis of Civilization: Water Science? (Proceedings of theUNESCO/IAMS/IWHA symposium held in Rome, December 2003). AI IS I’ubl. 286, 2004
**Brochure (Information about Fuji river Flood Control)
Day_194 : Tsunami Up and Down
When a large earthquake occurs at the bottom of the ocean, the ground suddenly lifts and sinks. This movement directly affects the surface of the ocean, creating large waves that spread far and wide. This is the typical way an earthquake-induced tsunami starts. Smaller earthquakes do not cause tsunamis because the shape of the ocean floor does not change much. Also, if an earthquake occurs very deep in the ocean, tsunamis do not occur because their effects do not reach the surface of the ocean. Large tsunamis are caused by huge earthquakes in deep ocean trenches, which are caused by the subduction of the Earth’s plates. In this type of earthquake, the ocean surface is pushed up or pulled down. On the side where the ocean is pushed up, the waves rise; on the side where it is pulled down, the ocean lowers. Which of the two is the first wave of a tsunami has a lot to do with how you perceive the danger and how you escape; the nature of the tsunami that hit Sumatra in 2004 (magnitude 9.0) caused the southern part of Thailand to be hit by a wave that pulled the ocean down, and the nature of this tsunami increased the damage.
Day_41: disaster vulnerabilities by regions
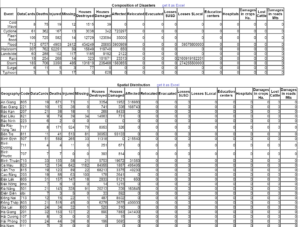
I just used 1980–2008 natural disaster data (ADRC 2009) and calculated the numbers of fatalities divided by the number of disasters to know the vulnerabilities. The regions mean Asia, the Americas, Africa, Europe, and Oceania.
The following is the order. Sorry, just order; however, we can learn something from the order.
The number of fatalities
1. Asia
2. Americas
3. Africa
4. Europe
5. Oceania
The number of fatalities divided by the numbers of disasters
1. Asia
2. Africa
3. Oceania
3. Americas
4. Europe
The above indicates the vulnerabilities of regions. For example, people in Africa tend to die easily by natural disasters; on the contrary, people in America tend not.
Day_71: The Tsunami history in Tohoku : 1896 Meiji sanriku tsunami
The Great East Japan Earthquake and Tsunami (GEJET) disaster is the deadliest disaster after the Second World War in Japan. The earthquake happened at 2:46 p.m. on March 11th, 2011. The total casualty number is 19,846 based on the EM-DAT. The maximum . tsunami height is 40m on the Sanriku Ria Coast. The first wave arrives approximately 30 minutes after the earthquake.
The Sanriku areas have a special geographical condition mentioned as the Sanriku Ria Coast. The coast has mountains close to the sea, so residential areas are limited only in the narrow and lower zones near the sea, and the areas become very vulnerable against the tsunamis. The bays on the coast are small, and the sea inside the bays is very deep. This makes tsunamis faster and higher, which is why the Sanriku Ria Coast has the highest tsunami risk area in the world.
Because of these characteristics, the communities on the Sanriku Ria coast, mainly in Iwate prefecture, have historically been severely affected by tsunami disasters such as the Meiji Sanriku Tsunami (1896), Sowa Sanriku Tsunami (1933), and Chilean Earthquake Tsunami (1960), compared to the flat coast mainly in Miyagi prefecture and other areas in Japan.
I will explain a little bit about the Meiji (1896). This disaster is so-called a surprise attack. The tsunami disaster happened at approximately . 7:30 p.m. on June 15, 1896, mainly on the Sanriku Ria coast. The dead and missing number has been reported at over 22,000. The earthquake is not so strong (the Japanese earthquake scale indicates Shindo 1-2); however, the tsunami is very strong and high (the maximum height is 38.2m in the Ayasato area (present-day Ofunato city)) compared to the earthquake movement scale. This has severe impacts.We call this huge tsunami caused by a weak earthquake Tsunami Earthquake. The first wave arrives approximately 35 meters after the earthquake. The Meiji (1896) has been the worst tsunami disaster ever in Japan.
In 1611, the larger tsunami (Keicho Sanriku Tsunami*) than Meiji hit the Sanriku area. That could also be a “tsunami earthquake.” After that, every 40 years, the people in the area tended to have a big tsunami. Even though they had such experiences, they did not have good tsunami disaster countermeasures, and the tsunami was a “tsunami earthquake.” In addition, they had some ancient traditions, like the idea that a tsunami was a punishment from the gods and Buddha. These are the main causes that made the Meiji worse.
Keicho Sanriku Tsunami
https://en.wikipedia.org/wiki/1611_Sanriku_earthquake
The Kyodo news company has obtained the pictures on the Meiji (1896)
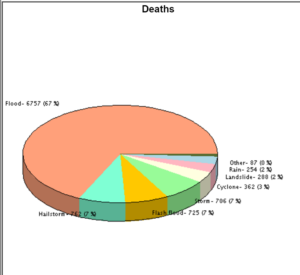
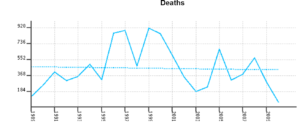
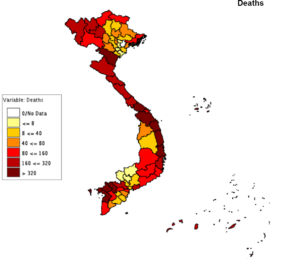
Day_53 : Disaster Information : Desinventar
Even though the countries are limited, UN Desinventar has really detailed disaster information. Let me share an example: Vietnam’s data.
Just click the target country (Vietnam), and you can see the different types of data, such as pie charts (disaster type), polygonal lines (trend), spatial (geographical distribution), and statistical (regional data).
The following are the screen shots:.
* UN Desinventar
http://www.desinventar.net/index_www.html
Day_36 : Disaster Scenario
A Disaster Scenario is one of the ways to raise our disaster management skills. This is a kind of role-playing or simulation. The science can be applied to make the scenario more real. The disaster scenarios can be applied from personal level to national one. We usually tend to have normalcy bias; however, well-planned disaster scenarios could break such bias.
* Normalcy bias (Wikipedia)
We tend not to want to accept abnormal situations.
Day_193 : Plates and Earthquakes
Earthquakes are caused by the cracking of the plates of rock (bedrock) that lie beneath the earth. Over time, forces build up on these rock plates and eventually they break. The force produced at that time is felt as an earthquake. The main reason for the plates to break is the movement of several large plates that cover the earth. These plates cover the surface of the earth and come in various sizes and shapes. When these plates collide or pass each other, earthquakes are likely to occur.
The Pacific Rim Seismic Zone, which encircles the Pacific Ocean, and the Himalayan-Alpine Seismic Zone, which extends from Indonesia through the Himalayas to the Mediterranean Sea. Japan is in the Pacific Rim seismic zone, and earthquakes occur frequently because of the movement of multiple plates beneath the ground. Depending on how these plates move, large and small earthquakes occur. Large earthquakes are especially likely to occur near deep ocean bottoms (ocean trenches). As the plates move, forces build up on land, which can also cause earthquakes.
Day_192 : What are the differences between cyclones, typhoons, and hurricanes?
The terms cyclone, typhoon, and hurricane all refer to the same meteorological phenomenon but are used in different regions of the world. They describe a large, violent tropical storm system with strong winds and heavy rain. Here are the distinctions:
- Cyclone is the term used in the South Pacific and Indian Oceans. The word “cyclone” is also used in a broader sense to refer to any circulating weather system over the ocean characterized by closed isobar patterns and circular wind movement, whether tropical or not. In the Indian Ocean and South Pacific, when the system reaches sustained wind speeds of at least 74 miles per hour, it is called a tropical cyclone.
- Typhoon is the name given to these storm systems in the Northwest Pacific Ocean, typically west of the dateline. Like hurricanes and cyclones, a typhoon forms over warm tropical oceans and gains energy. When the sustained winds in this system reach or exceed 74 miles per hour, it is officially referred to as a typhoon.
- Hurricane is the term used in the North Atlantic, Central, and Eastern North Pacific oceans. The criteria for being classified as a hurricane are the same as for typhoons and cyclones, with sustained wind speeds of at least 74 miles per hour.
The naming convention is primarily geographical. The structure and behavior of these storms are the same, and they all belong to the category of tropical cyclones. The difference in nomenclature does not imply a difference in the hazard or potential damage these storms can cause, which is primarily dependent on their size, strength, and the area they affect.
A condensed list of references to support the distinctions between cyclones, typhoons, and hurricanes:
- The World Meteorological Organization (WMO) provides official definitions and classifications for tropical cyclones, typhoons, and hurricanes based on regional basins.
- National Hurricane Center (NHC) and Central Pacific Hurricane Center (CPHC): Part of the United States’ National Oceanic and Atmospheric Administration (NOAA), these centers offer detailed information on hurricanes, including the distinctions between hurricanes, typhoons, and cyclones.
- The Australian Bureau of Meteorology (BOM) offers insights into cyclones, especially in the South Pacific and Indian Ocean regions, detailing their formation, classification, and impacts.
- Japan Meteorological Agency (JMA): Provides information on typhoons, their tracking, and impacts in the Northwest Pacific region.
- Indian Meteorological Department (IMD): Offers comprehensive data on cyclones in the Indian Ocean, including classifications and warnings.
These organizations are key in tracking, studying, and providing information on these storm systems worldwide. They use specific criteria for wind speeds, atmospheric pressure, and other factors to classify these storms according to the region they occur in.