Japan」カテゴリーアーカイブ

Day_145: Past Columns (in Japanese)

Past columns will be updated both in Japanese and English.

My past Japanese writings for an internet newspaper company and the research map researcher’s blog (Japan Science and Technology Agency’s site) can be checked in the following, but the article of the news company is not free and is not in English or Japanese.

http://www.nikkanberita.com/index.cgi?cat=writer&id=200507100351580

https://researchmap.jp/read0139271/%E7%A0%94%E7%A9%B6%E3%83%96%E3%83%AD%E3%82%B0/


Day_142 : World Disaster Chronology-1994-1995


Date Place Disaster Type Situations
1994.01.17 US, Southeastern Inland Earthquake 1994 Northridge earthquake *
M6.8, 60(D), one of the costliest natural disasters of US history
1994.02.15 Indonesia, West (Sumatra Island) Inland Earthquake M6.6~7.0, Over 200(DM)
1994.05- Bangladesh Cyclone Over 170 (DM)
1994.05.13 Afghanistan Inland Earthquake M6.0, Over160(DM)
1994.06- India / Pakistan Heat Wave Over 400 (D)
1994.06- Ethiopia Drought Over 5,000(D), Food shortage
1994.06- China, Central eastern Heavy Rain, Flood Over 700(DM), A part of Shanghai was inundated
1994.06.02 Indonesia, South (Java Island) Submarine Earthquake M7.8、死不270以上、津波。
1994.06.06 Colombia, South Inland Earthquake M6.6, 300-800(DM), Debris flow
1994.06.09 Bolivia, Peru Deep-focus Earthquake 1994 Bolivia earthquake M8.2 10(D)
1994.07- Rwanda Heat Wave Over 10,000(D), combined with Civil War
1994.08.18 Algeria, North Inland Earthquake M5.7, Over 150(DM)
1994.10.04 Japan, Kunashiri Island Submarine Earthquake The 1994 Hokkaido Toho Oki Earthquake M8.2-8.3, 15(DM), Tsunami
1994.11- India South Cyclone 190(DM)
1994.11.14 The Philippines Inland Earthquake M7.1 Over70(DM) Tsunami
1994.11- Italy Heavy Rain, Flood Over 60(DM)
1994.11- Egypt Lightning 560(DM) Lightning damage to Oil facilities
1994.11- Haiti, Cuba Hurricane, Flood Over 700(DM)
1995.01.17 Japan Inland Earthquake The 1995 Great Hanshin Awaji Earthquake * M6.9~7.3 5,500~6,400(DM)
1995.03- Afghanistan Heavy Rain, Flood, Landslide Over 360(DM)
1995.04- Bangladesh Strong Wind 700(DM)
1995.05.27 Sakhalin, North Inland Earthquake The 1995 Neftegorsk earthquake,M7.1~7.5, Over 1,989(DM) Neftegorsk city was destroyed and vanished from the map after the disaster
1995.05- Brazil Heavy rain, Flood. Landslide Over 80(DM)
1995.05- China Heavy rain, Flood Over 1,100(DM), Yangtze river flood
1995.06- India, Pakistan Heat Wave Over 800(D)
1995.06- Japan Heavy rain, Flood 9(DM), Destroyed Approx.200, Inundated over15,000
1995.07- US Heat Wave Over 800(D)
1995.07- D.P.R.Korea Heavy rain, Flood Over 60(DM)
1995.07- Thailand Heavy rain, Flood Over 200(DM)
1995.08- Morocco Heavy rain, Flood Over 150(DM)
1995.9- The Philippines Heavy rain, Flood Over 540(DM)
1995.11- The Philippines Typhoon, Flood Over 780(DM)
1995.12-  Kazakhstan Cold Wave Over 100(DM) Snowstorm

D: The number of Death M: Missing number DM: The dead and missing number

https://disasterresearchnotes.site/archives/2831

Related articles across the web

Day_136 : Disaster-Related Death (1)

Kobe Earthquake : 919 (22Dec.2015)
Great East Japan Earthquake and Tsunami : 3,472 (31Mar.2016)

What are the numbers?

The above numbers are the numbers of disaster-related deaths. The disaster-related death means the death which is not directly caused by hazards such as sickness, disease, and committing suicide. Especially , the disaster-related death number of GEJET is still increasing even 5 years after the disaster. This reflects aging society. The elderly people tends to have sickness and losing hope without family members. Local governments have been working hard to prevent such tragedies. They are visiting and watching the victims individually.

Day_122 : Japanese Disaster History after the Second World War (2)

Japanese disaster history has three turning points. The first is the Typhoon Isewan (Vera) in 1959. The second is the Kobe earthquake disaster in 1995, the third is the Great East Japan Earthquake and Tsunami (GEJET) disaster in 2011(Day_33).

https://disasterresearchnotes.site/archives/2439

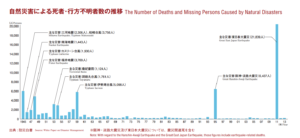
You can see the following figure 1 which displays the dead and missing numbers caused by natural disasters in Japan.

deathtollafterww2
Figure 1 The dead and missing numbers caused by natural disasters in Japan

After the second world war, Japan was vulnerable, so we had a lot of natural disasters, especially Typhoon disasters from 1945 to 1959. We call this 15 years a great flood and storm era. The first hit was Typhoon Makurazaki on Sep. 1945.The typhoon disrupted Hiroshima city. There were 1229 casualties in the city. This fact reminds us what happened in Hiroshima in the same year (Day_34(Re)).

https://disasterresearchnotes.site/archives/2866

The Isewan Typhoon has the following aspects: 1) Physical damages were tremendous 2) Lack of consideration of disaster prevention 3) Inadequate flood defense system 4) Inadequate warning and evacuation system ( The details will be explained later) After the Typhoon Isewan, disaster countermeasures basic act was enacted in 1961. The act combined many disasters related laws into one. After the Isewan Typhoon, we Japanese had thought we were successfully mitigating natural disasters.  You can see the dead and missing numbers were dropped right after the Isewan Typhoon by Figure 1.  This is mainly because of infrastructures and the development of science and technologies such as warning systems along with Japanese rapid economic growth. In addition, we had, fortunately, no huge natural hazards until the Kobe earthquake in 1995.

After the period of1960-1994, we have faced the Kobe Earthquake in 1995. Then, we realized that we could not prevent natural disasters, however, we could mitigate natural disasters after the earthquake. We also learned the importance of soft countermeasures as well as hard countermeasures. The Japanese Government had changed the policies again. The Kobe earthquake facilitated volunteer activities. Many social scientists started to investigate disasters. Before the disaster, natural scientists and engineers are the main players to do disaster-related research along with Japanese infrastructure centered policies. After that, we had confidence again and we thought we could be a model for other countries. The World Conference on Disaster Reduction was held in Kobe in 2005. Kobe city tried to be a center of world disaster-related organizations. (This Kobe earthquake disaster will be explained later)

However, we faced the Great East Japan Earthquake and Tsunami (GEJET) disaster in 2011. The GEJET disaster became the worst ever disaster in Japan after the second world war. The GEJET broke the Japanese confidence again and reconsider our strategies.

To be continued

*Disaster countermeasures basic act:
http://www.preventionweb.net/english/policies/v.php?id=30940&cid=87

sponsored link

Day_118 : World Disaster Chronology-1982-1988


Date Place Disaster Type Situations
1982.01- US and Europe Cold Wave Over 350(DM)
1982.01- Columbia Heavy Rain, Flood 90(DM)
1982.01- Peru Heavy Rain, Flood Over 3,000(DM)
1982.03- Philippines Typhoon Over 90(DM)
1982.03- Mexico, South Volcano  Mt. El Chichon Volcano Eruption, Over 150(DM)
1982.04- Peru Heavy Rain, Flood Over 200(DM)
1982.05- China Heavy Rain, Flood Over 430(DM)
1982 Nicaragua and others Heavy Rain, Flood 180(DM)
1982.06- Indonesia, WestSmatra Heavy Rain, Flood Over200(DM)
1982.06- India, Southeastern Heavy Rain, Flood 200-1,000(DM) Orissa
1982.07- Japan, Kyusyu Heavy Rain, Flood 1982 Nagasaki Heavy Rain Disaster,345(DM), Injured 660, Destroyed approx.850, Inundation over 52,000
1982.08- South Korea Typhoon, Flood Over 60(DM)
1982.08- Japan, Central Typhoon, Flood 95(DM), Injured170, Destroyed approx.5,300, Inundation over 113,000
1982.09- Japan, Central Typhoon, Flood 38(DM),Injured 170, Destroyed approx.600, Inundation over136,000
1982 Guatemala and others Heavy Rain, Flood Over 1,500(DM)
1982.10.06 Liberia  Landslide Over 200(DM)
1982.11- India Typhoon, Flood Over 270(DM)
1982.12.13 Yemen Inland Earthquake 1982 North Yemen earthquake, M5.8, 2,800-5,000(DM)
1983 Turkey, East Inland Earthquake Over 1,000(DM)
1983.02- Australia, Southeastern Forest Fire 75(DM)
1983.05.26- Japan, Northeastern Submarine Earthquake 1983 Sea of Japan Earthquake*,M7.7 104(DM), Injured160, Half Destroyed or more, over3,000
1983.07- Japan, Central Heavy Rain, Flood 1983 Heavy Rain,117(DM), Injured 160, Destroyed approx. 3,600, Inundation over 17,000, Damaged over 1.3mil yen
1983.09- Japan, Central Typhoon 44(DM), Injured 120, Destroyed approx. 600, Inundation over 56,000
1983.12- Japan Heavy Snow 96(DM), Destroyed approx. 900
1984.03.28 US Tornado The 1984 Carolinas tornado outbreak, 57(D)
1984.06.09 USSR Tornado The 1984 Soviet Union tornado outbreak. Over 400(D)
1985.03.03 Chile, Central Submarine Earthquake M7.8-7.9, 180(DM)
1985.08.23 China, Xinjiang autonomous region Inland Earthquake M7.3, Over 80(DM)
1985.09.19 Mexico, Southwestern sea (Mexico city) Submarine Earthquake 1985 Mexico city earthquake, M8.1,9,500-35,000(DM)
1986.08- Japan, Kyusyu and others Typhoon, Flood 21(DM), Injured100, Destroyed approx.2,600, Inundation over 105,000
1986 El Salvador Inland Earthquake 1986 San Salvador earthquake M5.5-5.8, Over1,000(DM)
1986.10.20 Kermadec Islands Submarine Earthquake M7.7-8.2
1987.03.06 Ecuador, South Inland Earthquake Ecuador Earthquake (M6.7-7.1) 1,000~5,000 (DM)
1987.10- Japan, West Typhoon, Flood 9(DM), Destroyed approx.200, Inundation over 24,000
1987.12.17 Japan, East Submarine Earthquake Chiba Ken Toho Oki Earthquake,M6.7,2(D), Injured 160
1988.02- Mozambique Cyclone, Flood Cyclone Filao, approx.100(D)
1988.07- Japan, Kyusyu and others Heavy Rain, Flood 27 (DM), Injured 60, Destroyed approx.600, Inuncation over 10,000
1988.08.21 Nepal   1988 Nepal earthquake M6.9,  killing at least 709 persons and injuring thousands.
1988.11- Bangladesh Cyclone, Flood 6240(D) One of the worst tropical cyclones in Bangladeshi history. 
1988.09- Mexico, and others Hurricane Hurricane Gilbert, 318(D)
1988.10- Caribbean and Central America Hurricane Hurricane Joan–Miriam, 216-334(D)
1988.10- Guam, Marianas Islands, Philippines, China Typhoon Typhoon Ruby, Over 300(D)
1988.11.06 China and Myanmar Inland Earthquake M7.0-7.3, Over 700(DM)
1988.11.28 US, North Carolina and  Virginia  Tornado 1988 Raleigh tornado outbreak, 4(D),Injured 154
1988.12.07 USSR, South (Armenia) Inland Earthquake 1988 Armenian earthquake,M6.7-6.9, 25,000-45,000(DM)
Economic damage is 140 million dollar , worst earthquake disaster in USSR history

D: The number of Death M: Missing number DM: The dead and missing number

1983 Sea of Japan Earthquake*

https://disasterresearchnotes.site/archives/2722

Day_111 : Earthquake Information (1)

Introduce you two earthquake information websites. 1) The Earthquake Track 2) J-RISQ

1) The Earthquake Track

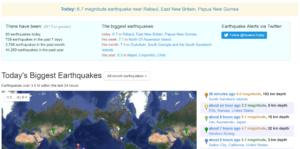
The Earthquake Track is useful to overview the earthquake occurrence situation in the world (Figure 1). As you can see in the below figure, every day’s earthquake occurrence situation such as how many times the earthquake occurred, what is the biggest earthquake of the day, and the earthquake locations on the map can be seen. Also, we can access to the detailed information of the quakes.

160831_earthquakepic1
Figure 1  The Earthquake Track

2) J-RISQ

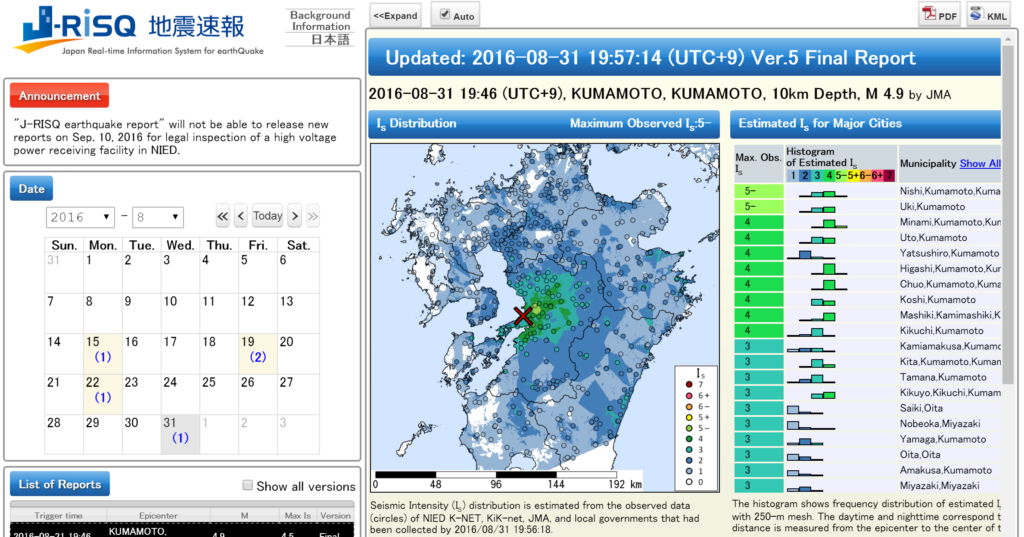
Figure 2 shows J-RISQ provided by the National Research Institute for Earth Science and Disaster Prevention (NIED).

160831_JRISQ1
Figure 2  J-RISQ website

As you can see the Figure 2, this site does not only provide earthquake (hazard) information but also affected population estimation (exposure). In addition, the site gives us historical information of the affected area. You can also refer prediction data on the map such as earthquake distribution of 2% probability of exceedance in 50 years and distribution of return period of 50,000-year.

Day_104 : Lessons from a Japanese Environmental Movement- The Matsumura Research Group (2)

Mishima Numazu Shimizu (MNS) environmental movement in 1963-1964 is the turning point of a Japanese environmental history. The core of the movement is the science-based issues, especially, The Environmental Impact Assessment conducted by the Government Research Group and the Local Research Group.

https://disasterresearchnotes.site/archives/2981

Proposed the Development Plan

The below Figure 1 and Table 1 indicate the proposed development plan. These are the companies which had planned to come to the area. You can also see the scale of the plan.
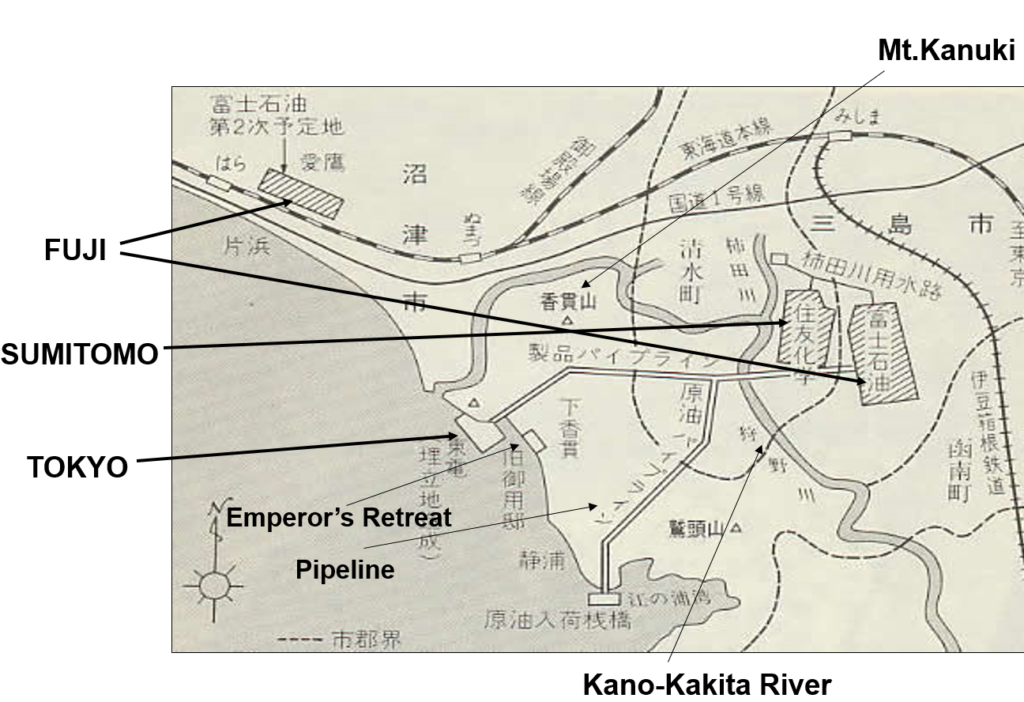
planned project MNS
Figure 1  Proposed an Industrial Complex Plan

Table 1 The Scale of the Plan
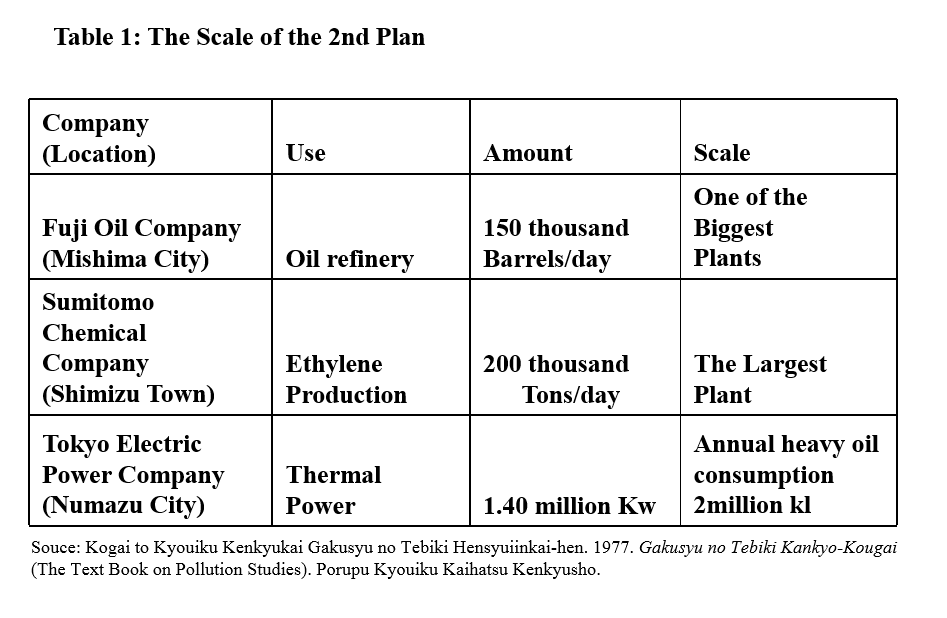
The planned MNS

What is the MNS Movement?
The following two factors can be highlighted to explain the MNS movement. The first, the survey carried out by students (KOINOBORI research). The second, a few hundred education programs (mainly for local citizens)

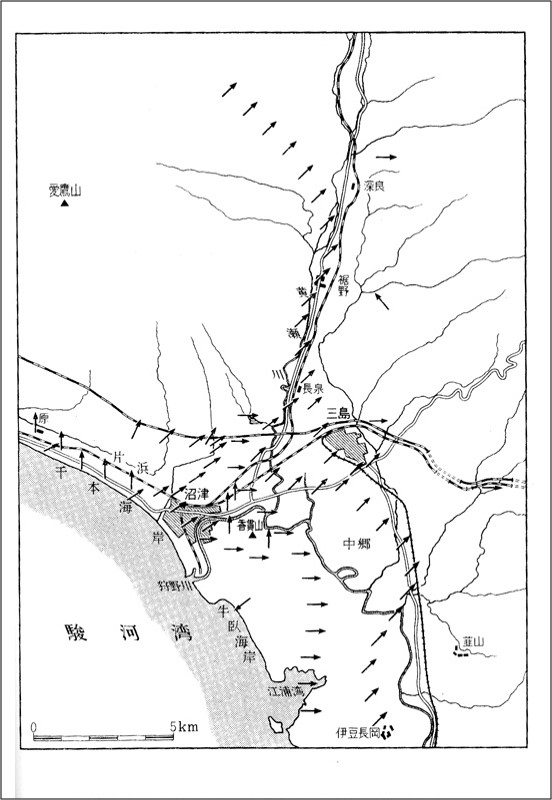
In regard to the student survey, the survey carried out by students of Numazu Technical High School consists of three types by using local materials which were KOINOBORI, empty bottles and thermometers. The KOINOBORI were used in the air current survey that was conducted by about 300 students. The students made some air current maps that showed that the government’s appraisal of wind direction was incorrect. These maps gave decisive data to the Matsumura research group. Empty bottles were used for the water current survey. Thermometers enabled the students to make some maps showing the variation of temperatures.

On the other hand, the results of the survey reported by students of East Numazu High School which were called “Petrochemical Complex Project in Numazu and Mishima Area” was conducted by a Local Research Club. They researched it by using social scientific methods (including the survey in Yokkaichi City). The MNS activists use this report.

With reference to the education programs, many education programs were conducted by Numazu Technical High School teachers. They were held at schools, at the town halls and in the streets. Because of the programs, local citizens (including farmers and fishermen) became eager to learn. Local citizens wanted to know what was going on in their locality.

The Students Participatory Survey

The following Figure 2  shows the wind directions are from the sea to the land. This map was created by the students during the Koinobori time. This means the local people would be influenced by the pollutions from the planned factories. However, the government survey appealed the different ways.
Wind directions student survey
Figure2  Wind directions survey conducted by high school students
(Source :  Mitsuo Taketani, 1967)

The Kurokawa Research Group (Gov. Research group) carried out the first largest ever Environmental Impact Assessment (EIA) by the Japanese government in 1964. The representative was Dr.Masatake Kurokawa and the staff consisted of national academics. The budget was about 20 million yen (about 180,000 USD) at that time. The research was carried out by using helicopters and high-tech machines. The Kurokawa Research Group was nominated by the Minister of International Trade and Industry and the Minister of Public Health.

On the other hand, the Matsumura Research Group carried out the EIA by getting the cooperation of local people, including high school students. The representative was Dr.Seiji Matsumura and the staff consisted of two researchers with international experience and local high school teachers (Table 2). The budget was about 100 thousand yen (about 900 USD) at that time. The research was conducted using readily available materials and low-tech manpower (for example, Koinobori research). It meant that research people, as well as the local people and high school students, used their own ideas. The Matsumura research group was nominated by the Mayor of Mishima city, Mr.Taizo Hasegawa. They use students, local materials, and Japanese culture.

Table 2 Matsumura Research Group

local research group members
* I have life stories about them by interview surveys

The Formation of the Matsumura Research Group

The following is the formation process of the Matsumura Research Group. The National Institute and the Local high school have bonded together. These make ‘Think globally, act locally’.

  1. Education Seminar about Pollution Held by Two High School Teachers and a Professor
  2. Explanation of the Estimated Pollution Levels Given to the NIG (National Institute of Genetics) by Mr.Nagaoka and Mr.Nishioka (Teachers)
  3. Decided by the NIG Members to Refuse the Petrochemical Complex Plan
  4. Advice Given to Mishima City’s Mayor (Hasegawa) from the NIG Members to Establish the Research Committee for EIA
  5. Decision by Hasegawa to Reject the Proposed Petrochemical Complex
  6. Acceptance of Numazu Technical High School and NIG to do EIA in the Area

To be continued.

Day_99 : A Secondary Disaster- 1972 Shigeto Landslide Disaster

The Shigeto ward, Tosayamada town in Kochi prefecture had a huge landslide disaster on the 5th of July in 1972. We call it Shigeto Landslide.

What we can learn from this landslide is the secondary disaster.

First, a small landslide occurred at 6 am on the day. One volunteer firefighter was buried alive by the landslide. Other volunteer firefighters and local people started to conduct rescue work for him.

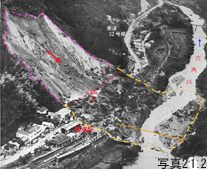
Second, a huge landslide happened at 10:55 am during their tasks and killed 59 among them. In addition, the landslide pushed the train stayed at Shigeto station away.

The following Figure 1 shows the landslide (NIED DIL)

shigetoupic
Figure 1 Shigeto Landslide

Day_98 : The Major Tsunami disasters in Sanriku Ria Coast in Japan

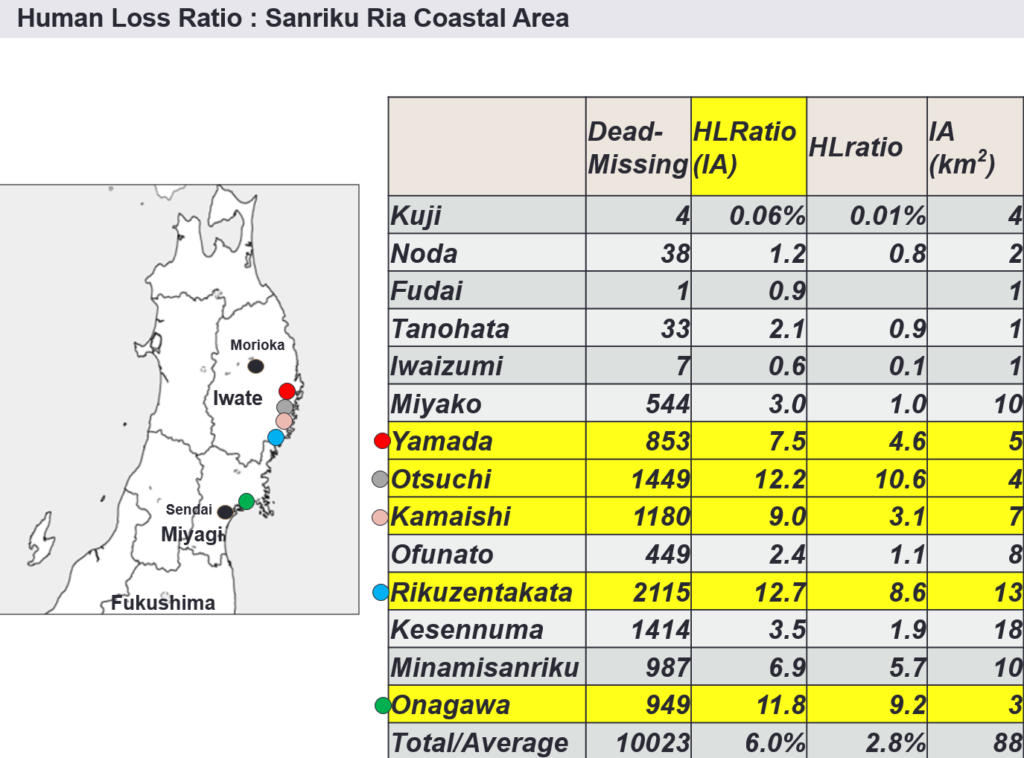
The following slide indicates the Great East Japan Earthquake and Tsunami(GEJET)disaster’s data by each municipality (IRDR conference).You can see the fact that Sanriku ria coast has more severe damage compared to the population of the municipalities.We also need to notice the Sanriku ria coast has a long history of tsunami disasters.But why did they have a sever damage again?

sanriku tsunami history death
Figure 1 Tsunami Disaster Impact in the Sanriku Ria coast (IRDR)

The Sanriku areas have a special geographical condition mentioned as Sanriku ria coast. The coast has mountains close to the sea, so residential areas are limited only in the distributed, narrow and lower zones near to the sea and the areas become very vulnerable against the tsunamis. The bays in the coast are small and the sea inside the bays are very deep. This makes tsunami faster and higher, this is why the Sanriku ria coast makes the one of the highest tsunami risk areas in the world.

Because of these characteristics, the communities in Sanriku ria coast, mainly in Iwate prefecture historically has been severely affected by tsunami disasters such as Meiji Sanriku earthquake tsunami (Meiji (1896)), Sowa Sanriku earthquake tsunami (Sowa (1933)), and Chilean earthquake tsunami (Chilean (1960)) disasters compared to the flat coast mainly in Miyagi prefecture and other areas in Japan.

See the below “Relocation or Rebuilding (1)”

http://disasters.weblike.jp/disasters/archives/2950

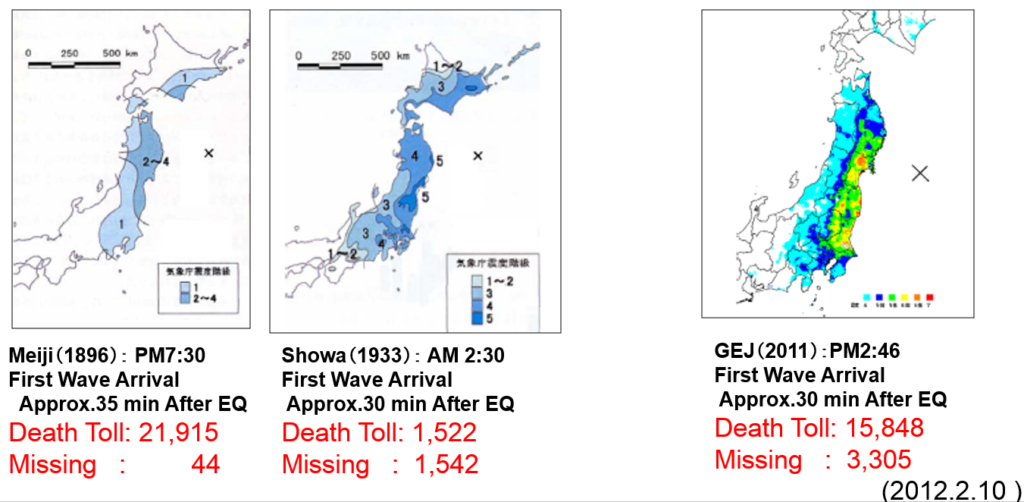
The following is the brief explanations of each tsunami disaster. The Figure 2 (Figure 1 of the Day_94 post) does not include the Chilean Tsunami.

sanriku tsunami history
Figure 2
 The Tsunami Disasters in Tohoku (Cabinet office of Japan)

1) Meiji sanriku tsunami disaster(1896), this disaster is so called a surprise attack tsunami disaster happened at approx. 7:30 pm, 15th of June in 1896 mainly in Sanriku ria coast. The dead and missing number has reported over 22,000. The earthquake is not so strong (Japanese earthquake scale indicates Shindo 1-2), however, tsunami is very strong and high (max. height is 38.2m at Ayasato area (present Ofunato city) compared to the earthquake movement scale. The first wave arrival is approx.35m after the earthquake. The Meiji sanriku tsunami disaster (1896) is the worst tsunami disaster ever in Japan.

2) Showa sanriku tsunami disaster(1933), this tsunami disaster can be examined the lessons learned from Meiji (1933) mitigate the impacts. This tsunami attacked mainly the Sanriku ria coast at approx. 2:30 am, 3rd of March in 1933. Even if the midnight, the residents evacuated so quickly because of their memories of the Meiji (1896) with strong earthquake (Japanese scale is Shindo 5.5). The max. tsunami height is 23m at the same place, Ayasato area, with Meiji (1896). The first wave arrival is approx.30 min. after the earthquake.

3) Chilean tsunami disaster(1960), this is caused by the tsunami generated offshore in the long distance. This is coming from Chile in South America. The earthquake occurred in Chile was magnitude 9.5 and this huge earthquake generates tsunami and reach to Japan after 22 hrs and a half. The tsunami come approx. at 3 am, 23rd of March in 1960. The death number is 139 all over the Japan and Sanriku ria coast is the worst such as 63 in Ofunato, 37 in Shizugawa (present Minamisanriku), and 8 in Rikuzentakata.

4) Great East Japan Earthquake and Tsunami(GEJET) disaster(2011), this disaster is the deadliest disaster after the Second World War in Japan. The earthquake happened at 2:46 pm, 11st of March in 2011. The total casualty number is 19,846 based on the EM-DAT.The max.tsunami height is 40m at the Sanriku ria coast. The first wave arrival is approx. 30 min. after the earthquake.

Day_96 : Lessons from a Japanese Environmental Movement- The Matsumura Research Group (1)

Mishima Numazu Shimizu (MNS) environmental movement in 1963-1964 is the turning point of a Japanese environmental history. The core of the movement is the science-based issues, especially, Environmental Impact Assessmentsconducted by the Government Research Group and the Local Research Group.

They fought the results and local people finally assisted the local research group research findings and explanations to choose their future.

Actually, this is the first national EIA (Environmental Impact Assessment) in Japan, which failed and almost all Japanese do not know.

I conducted field research on the local research group for a long time. I stayed local member’s house for over 1 week and collected the documents, for example. Unfortunately, almost all members have passed away now. The followings are the outlines.

Background
In 1963, the national government and local councils proposed the one large industrial complex in Mishima city, Numazu town, and Shimizu town area in Shizuoka prefecture near to the Mt.Fuji.This was one of the largest development projects in Japan at that time. After this announcement, the MNS environmental movement was started with the local people. Local high school teachers and national research institute researchers led this movement with their scientific and local knowledge.

Revolutionary Events in the MNS Movement
– The survey carried out by high school students (KOINOBORI research)
because it happened  in a KOINOBORI time (Japanese culture)
→A high school teacher (The Matsumura Research Group member) led this survey.
→These results were accurate in the local wind direction which was against governmental research findings with explanations. Gov. research group had a huge budget, they used a helicopter to check the wind directions

koinobori
Figure 1 Koinobori   (Source: Wikipedia)

– A few hundred education programs (mainly for local citizens)

The Main Impact of the MNS movement
Former high-ranking officer confessed:
“We (the government) thought we had lost when the Numazu citizens flew those KOINOBORI (carp-shaped streamers) for research purpose. Besides that we also realized that we needed to make laws governing pollution. If we had not done it, we could not have been able to set up any MNS type projects”

The Main Impact of the MNS movement
Prevention Movement against Pollution
Local Government Reform Movement
Legal Action in the Movement
Conducting Independent Research
Implementing Environmental Education Programs

After the movement, Kawasaki City, Tokyo Metropolitan Area,
and Kyoto City became reformist local governments, which
control pollution more seriously than the national government.

Matsumura Research Group
Outcome: “Self Assessment” by the local research group overcome
the “Official Assessment” by the national research group

Mr. Shiramatsu (LDP) criticized during the time in the assembly:
“The Kurokawa Research Group (the national research group) is reliable.
It consists of the country’s most respected specialists in various fields.
They could be called the nation’s best brain. On the other hand, the
Matsumura Research Group (the local research group) is unreliable.
The member are 2 doctorates of Agriculture and 4 high school teachers.
How could they carry out reliable research?
In addition, I heard the budget
of the Matsumura Research Group is about 100 thousand yen. So the research
could be regarded a non-scientific thing”.

To be continued・・・・・

sponsored link