Category Archives: Flood

Day_103 : New Orleans and Hurricane Katrina in 2005

Day_100 indicated a human suffering exacerbation process in New Orleans during the 2005 Hurricane Katrina.

http://disasters.weblike.jp/disasters/archives/2975

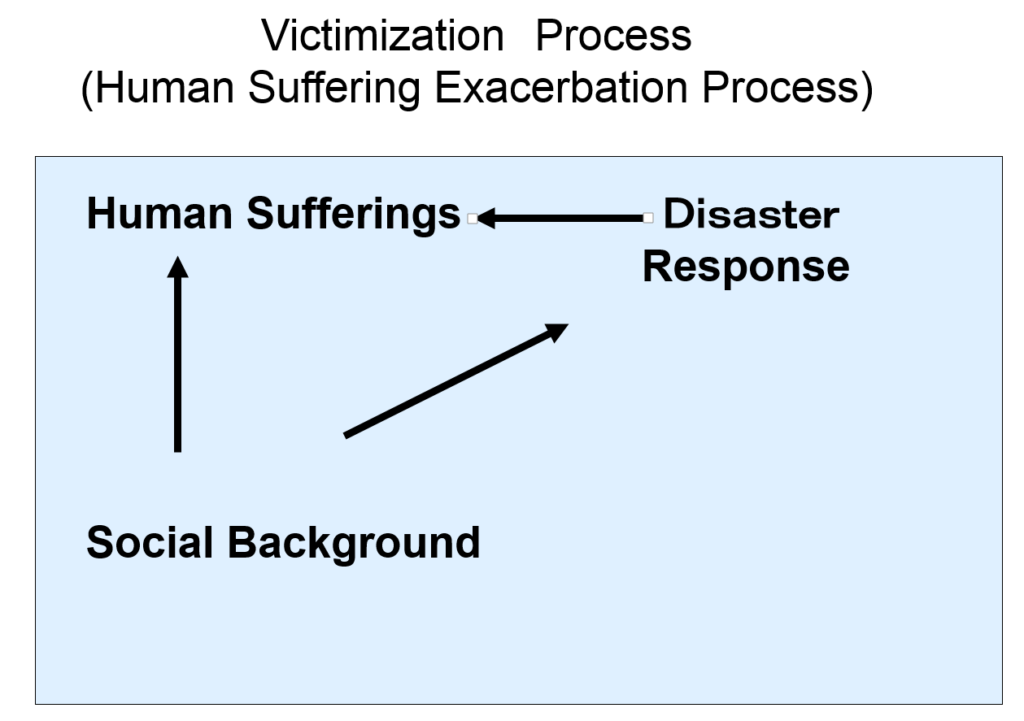
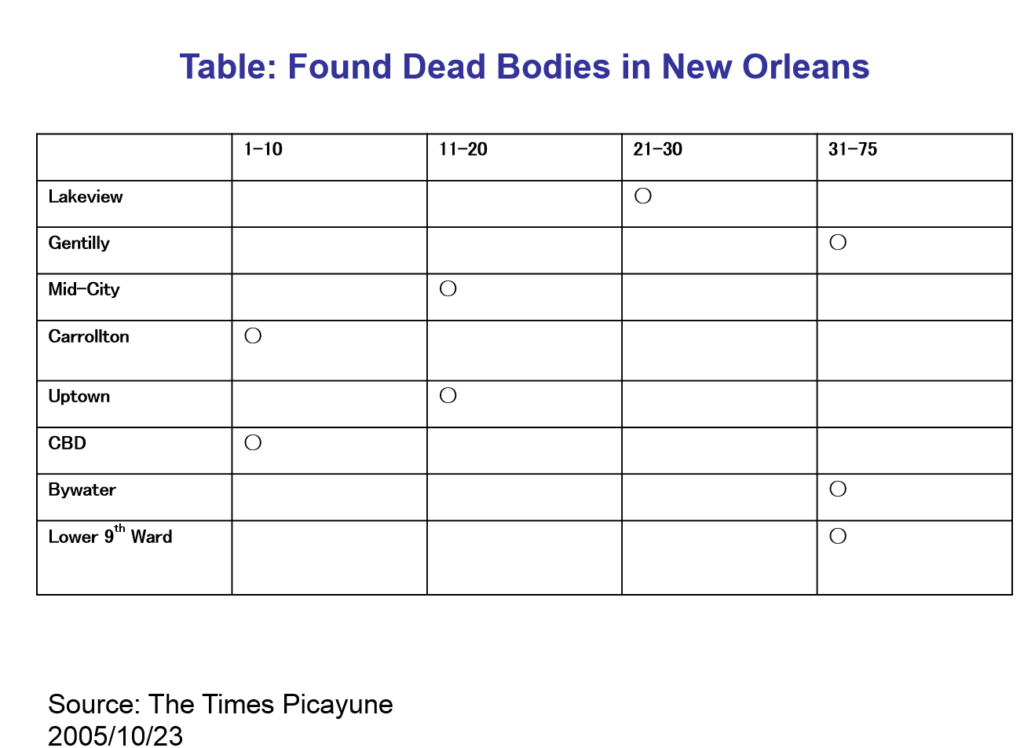
The Figure 1 again shows the relationships between the human suffering exacerbation process and social backgrounds with data. Table 1 also indicates the estimated death numbers in some wards.

exacerbation2
Figure 1 Human Suffering Exacerbation Process and Social Background

Table 1 Found Dead Bodies in New Orleans

dead in neworleans

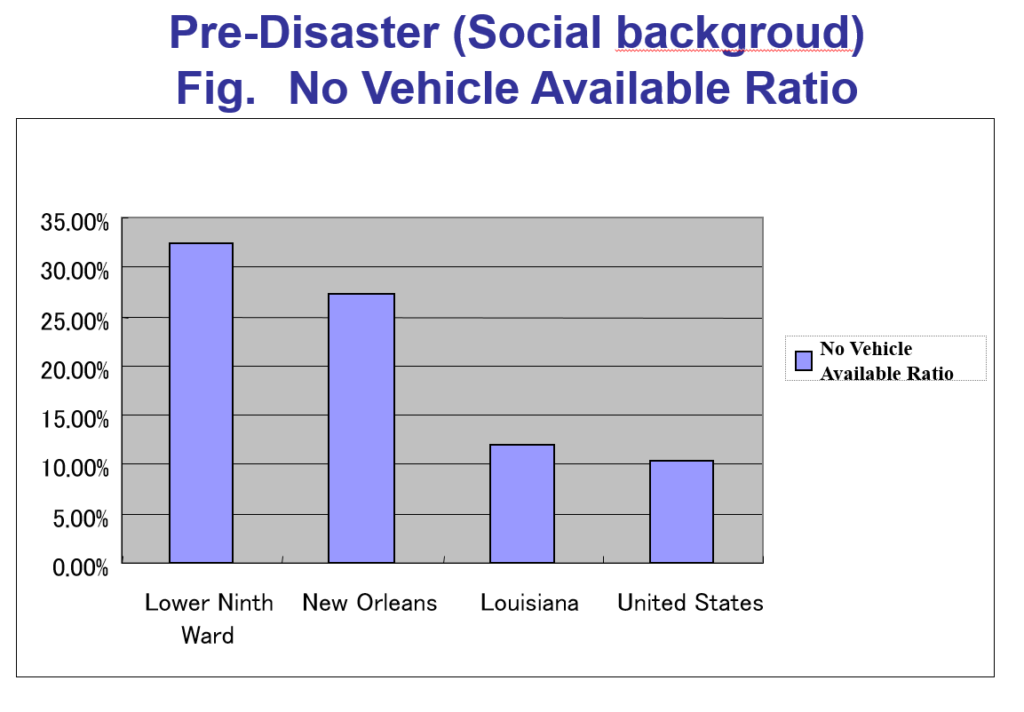
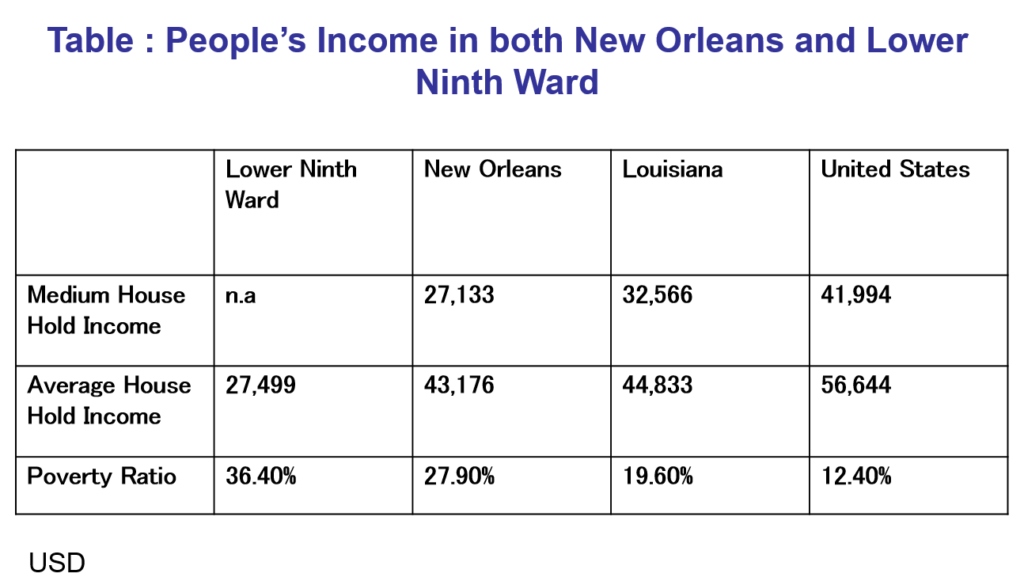
The total views are indicated in the following Figure 2, 3, 4, and Table 2.
Concerning the population change, New Orleans is the one of the decreasing communities in US. For example, rapid urbanization related matters caused environmental degradation before the disaster. Campanella(2004)mentioned New Orleans became not a sustainable, but a survival city. The lower 9th ward, for example, with regard to the ethnicity, we can see the high black and the African American proportion.  With respect to Income, we can also identify the people living in the Lower 9th ward have lower incomes.

NOLApopulation
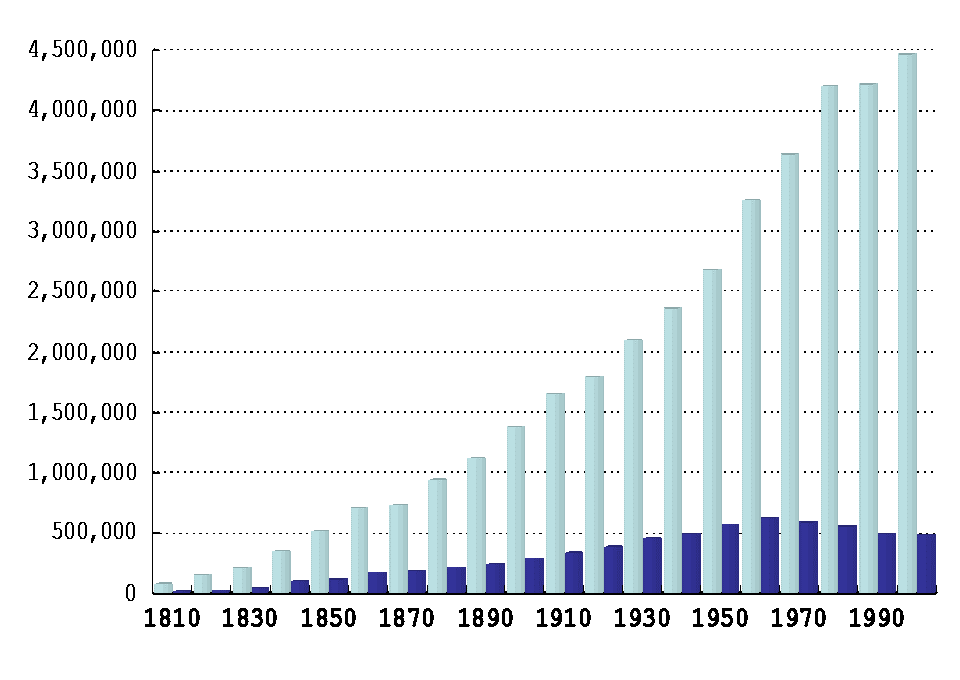
Figure 2  Population Change Louisiana( Light Blue ) and New Orleans (Dark Blue)


2000census
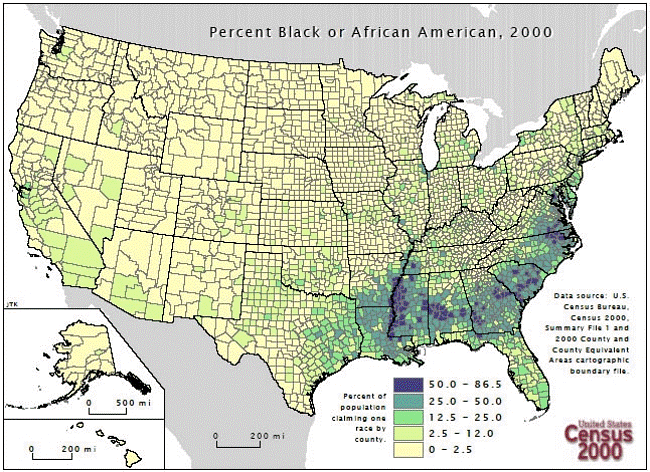
Figure 3 Percent Black or African American, 2000 (Census, 2000)

pop and ethnicities
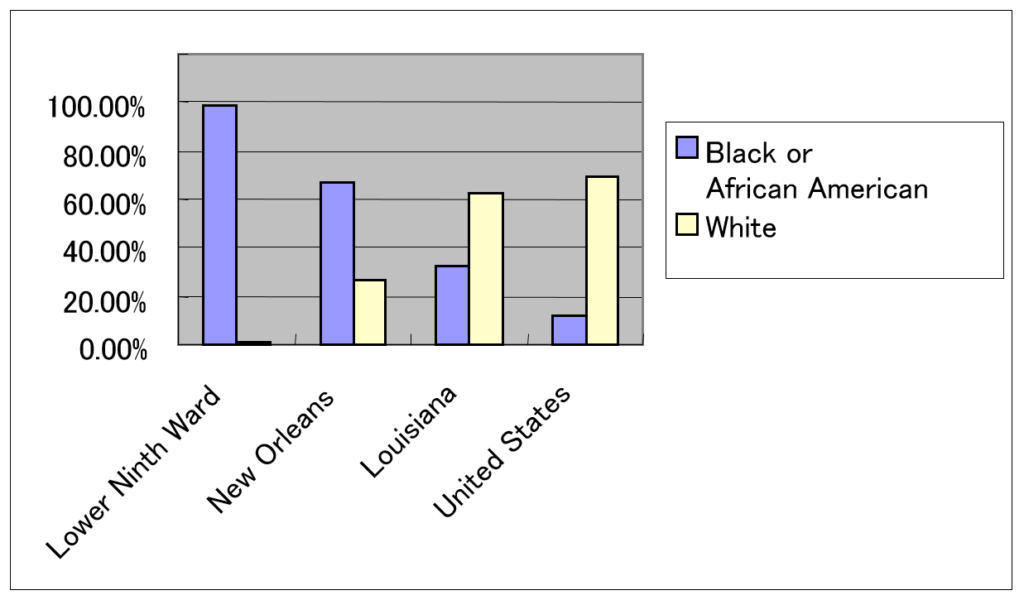
Figure 4 Percent Black or African American and White
(Source: Congressional Research Service)

Table 2 People’s Income in both New Orleans and Lower 9th Ward

income katrina

These are referred by an NIED publication.

Day_100 : A Human Suffering Exacerbation-Data from Greater New Orleans Community Data Center

The Greater New Orleans Community Data Center (GNOCDC) website was found after the field survey on Hurricane Katrina in Louisiana and Mississippi in 2005. I was so amazed. This is the one of the demographers great contributions to disaster research.

The site provides the information of the pre-Katrina situations by parish and also by ward. This is very useful to examine the social backgrounds of the areas in detail.

gnocdcPrekatrina
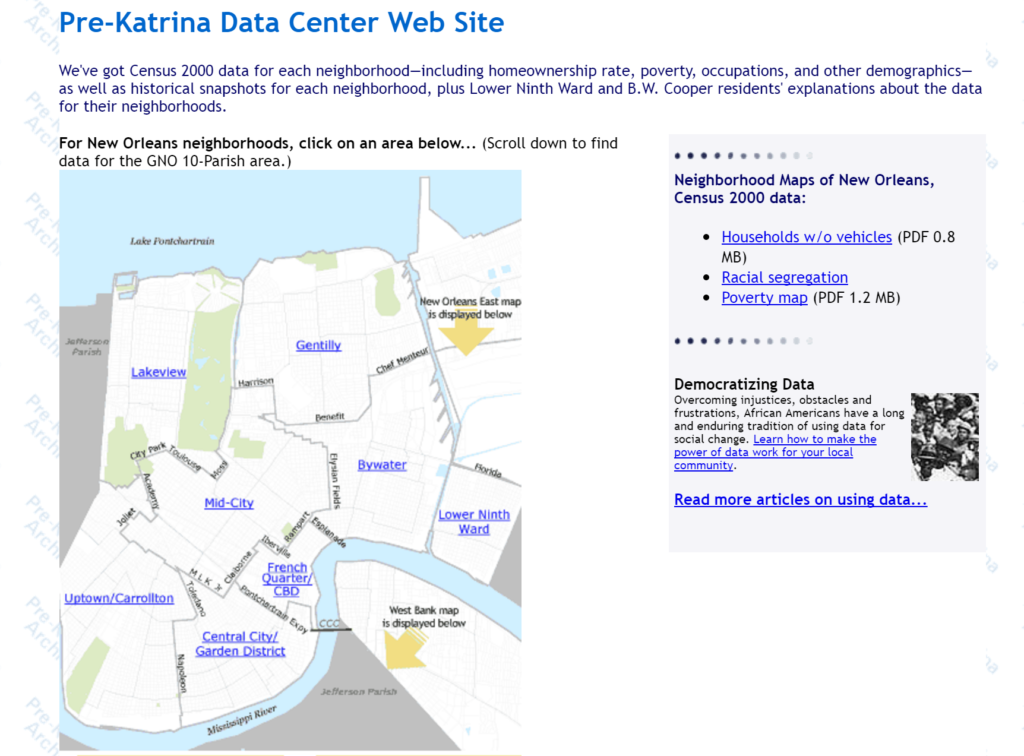
Figure 1 GNOCDC (Pre-Katrina data site)

The paper on Karina disaster using these data is to explain how human sufferings were exacerbated by the stage with the social background as shown in Figure 2 (Nakasu, 2006 :Sorry in Japanese, however, summary and figures are in English).

human suffering
Figure 2 Victimization Process

exacerbation2
Figure 3
Victimization Process by Stage

Table 1 Found Dead Bodies in New Orleans  

dead in neworleans

The process can be divided into five stages with time such as A) Pre-disaster B) Direct damage C) Social disorder D) Life environment  E) Reconstruction and recovery. Then, these are examined with the social background data (Figure 3).

For example,  1) Pre-disaster stage, I picked up an evacuation aspect to explain the social background of this stage.

Using the GNOCDC database, I could check the possession ratio of the vehicle in some areas.

novehicle
Figure 4 No Vehicle Available Ratio (GNOCDC)

Table 1 and Figure 4 show the people in Lower 9th ward, one of the most severely affected areas, had a low possession ratio of the vehicle. This can explain so many residents needed to have government help to evacuate and they could not evacuate before the Hurricane hit.

The general social background, such as ethnic groups, household incomes, and others with other stages of examinations will be discussed later.


The Great Deluge: Hurricane Katrina, New Orleans, and the Mississippi Gulf Coast (English Edition)

Day_97 : World Disaster Chronology 1976 (2)


Date Place Disaster Type Situations
1976.08.17 The Phillipines, South
Mindanao
Submarine earthquake 1976 Moro Gulf earthquake and tsunami*: M7.8-8.1,A dead and missing number is 4,000-8,000
1976.09- Japan Typhoon 1976 Typhoon No.17 Flood (Nagara river flood
A dead and missing number is 169, Injured 400
1976.10.28- Japan, North-eastern Strong wind Sakata conflagration: A death and missing 2, Injured over 900
1976.10.29 Indonesia, East Irian Jaya Inland earthquake M7.2, A death and missing number is 100-6,000not confirmed),landslide
976.11.24 Turkey and Iran border Inland earthquake  1976 Çaldıran–Muradiye earthquake**: M7.2-7.6, A death and missing number is 3,600-10,000
1976.12- Japan Snow  A death and missing number is 84, Injured over300, damage loss 40 billion yen

1976 Moro Gulf earthquake and tsunami*
The worst tsunami disaster in the Philippines.1) It happened while most people were sleeping.
2) No warning after the earthquake.

1976 Çaldıran–Muradiye earthquake**
The almost all houses were destroyed because of the structure constructed of thick walls made from rubble masonry cemented with mud mortar.

[ad#ads1]

Day_80 : The Metropolitan Area Outer Underground Discharge Channel

The Metropolitan area around Tokyo had suffered flood disasters with the rapidly growing population and urbanizations after the second world war. Because of this situation, the “Metropolitan Area Outer Underground Discharge Channel” was established. This flood defense system is really really great. I recommend you to watch this with your own eyes when you have an opportunity to visit the metropolitan area around Tokyo in Japan. You can see like an underground temple shrine sanctuary.

You can see that by the following video:

[ad#ads1]