Category Archives: Demography

Imagine from Disaster Damage StatisticsReading Between the Numbers: What Disaster Damage Statistics Really Tell UsImagine from Disaster Damage Statistics

The following is the revised version of my past short essay for the institution’s mail magazine:

There is an index called the World Risk Index. According to the World Risk Report, Bangladesh ranked among the highest-risk countries in the world in 2019. Indonesia and Haiti also came to mind readily, their names long associated with devastating earthquakes in recent memory.

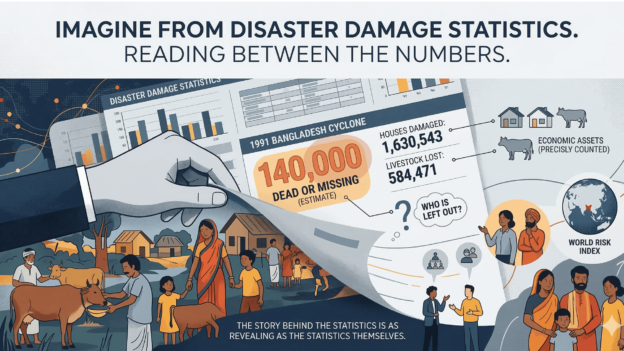
During a study session at my institution, I had the opportunity to examine Bangladesh’s disaster history from a land environment perspective — particularly the catastrophic cyclones of 1970 and 1991. The reported death tolls were staggering: approximately 500,000 and 140,000 lives lost, respectively. The sheer scale of these figures was striking, but what caught my attention was something subtler — why were these numbers so rounded?

When I looked more closely at the damage breakdown table, something immediately stood out. For the 1991 cyclone, the data recorded 1,630,543 houses damaged, 140,000 people dead or missing, and 584,471 livestock lost. House damage and livestock figures were precise to the single digit. Human casualties, by contrast, were a rough estimate.

That contrast is telling. It reflects not a statistical coincidence, but something deeper about how societies count — and what they choose, or are able, to count. Understanding Bangladesh’s social fabric — its caste structures, religious communities, and the central role of livestock in rural livelihoods — helps explain why certain losses were carefully documented while others remained approximate. Livestock, after all, represent measurable economic assets. Human lives in crisis, particularly among the most marginalized, are far harder to account for.

This gap becomes even more apparent when we look at 1970: no reliable death toll exists. Estimates from various sources range from 200,000 to 550,000 — a spread of 350,000 lives.

When a disaster strikes, damage figures circulate quickly. But I have come to believe that one of the most important analytical habits we can develop is to ask: Where do these numbers come from? What do they capture — and what do they leave out? The story behind the statistics is often as revealing as the statistics themselves.

By the way, the website is
https://reliefweb.int/sites/reliefweb.int/files/resources/WorldRiskReport-2019_Online_english.pdf
Issued July 5, 2010 No. 6

Source: 

1. NIED-DIL mail magazine: 6
Imagine from disaster damage statistics
Contribution day and time: 2013/08/19

2. Day_167: Imagine from Disaster Damage Statistics, Disaster Research Notes

【Project launched (website)】Disaster Risk Management in Aging Societies: Bridging Japanese Experience with Thai Policy Needs

Disaster Risk Management in Aging Societies

【Disaster Research: Infograph】AI-Integrated Disaster Preparedness Platforms (Open Access Examples)

The infographic of the AI-Integrated Disaster Preparedness Platforms is shown as an infographic: AI-Integrated Disaster Preparedness Platforms

Day_89 : Disaster Recovery Theory (1)

First, the theoretical examination’s concept is explained and two disaster recovery theories are introduced. Second, the first theory is explained and studied. Third, the second theory is explained and examined.

The concept is explained as follows:

The concept

Figure1 1: Disaster Recovery Concept

The following are the two disaster recovery theories used for this study.
Theoretical framework 1
Disasters contribute to change, they do so primarily by accelerating trends that are already underway prior to impact (Bates et al., 1963; Bates, 1982; Bates and Peacock, 1993; Haas et al., 1977).

2) Theoretical framework 2
The disaster Process is influenced by
① Devoted aid volume from outside society
② Disaster scale
Community Strength (Social System Strength) (Hirose, 1982)

The first theory is confirmed by some cases. You can see the following figures: the Kanto earthquake, Fukui earthquake, Typhoon Isewan in Japan, and Hurricane Katrina in US.
mizutanisensei_recovery
Figure 2: Disaster Recoveries in Japan

recovery_katrina
Figure 3: The Disaster Recovery from Hurricane Katrina in US.

To be continued…

This is  the presentation summary. The presentation was made in 2011, after the tsunami in Japan.

Day_75 : Okushiri Island (2)

The 1993 southwest-off Hokkaido earthquake hit okushiri island severely. The number of casualties was 165. Okushiri town had faced population-decreasing and aging issues before the disaster. After the disaster, Okushiri town had a lot of aids, especially from inside of Japan. Japan had a very good economy at that time, so the situations enabled them to have such huge aids. Even though the large economic assistance, the town’s demographic tendency before the disaster was facilitated. total population is from 4,604 (1990) to 2,662 (2015), and the aging proportion over 65 is from 15.6% (1990) to 38.6% (2015)*.

Below is the graph, which indicates the demographic changes on the island.
okushiri population

Some disaster recovery theories can be referred to explain this tendency clearly We should learn from this lesson to consider for our common sustainable futures.

*Day_43

https://disasterresearchnotes.site/archives/2510

[ad#ads1]