Day_114 : World Disaster Chronology-1980


Date Place Disaster Type Situations
1980.01- US, East Cold Wave 100 (DM)
1980.01- India, North Cold Wave 80 (DM) Bihar 
1980.04- Peru Heavy Rain, Flood 90 (DM)
1980.05- US, Northwestern Volcano  Mount St.Helens Volcanic Eruption*  80 (DM), A summit was disappeared by landslide and huge volcanic eruptions.
1980.06- India Heavy Rain, Flood Over 600 (DM)
1980 India Disease Over 550 (D)
1980.07- Japan Cool weather damage Damage cost was over 6,900 mil, yen
1980.07.28 Nepal Inland Earthquake (not confirmed), 90(DM)
1980.08- Japan Heavy Rain, Flood 26 (DM),Injured 50, Destroyed 400, Inundation over 39,000
1980.08- US, East Heat Wave 1,000-1,300 (DM)
1980.08- India, East Heavy Rain, Flood Over 1,500 (DM)
1980.08- Haiti Storm, Flood 270 (DM)
1980.08- China Heavy Rain, Flood Unknown (DM)
1980 Bangladesh Heavy Rain, Flood Over 650 (DM)
1980.09- India, Southeastern Heavy Rain, Flood 200 (DM), Orrisa
1980.10.10 Algeria, Northwestern Inland Earthquake  M7.1-7.5, El Asnam Earthquake 2,600-5,000(DM)
1980.10- India Infectious disease Over 400 (D)
1980.10.24 Mexico, Central Inland Earthquake (unknown), 65 (DM)
1980.11.23 Italy, South Inland Earthquake 1980 Irpinia earthquake** M6.9   2,500-4,700 (DM)
1980.12- Japan Heavy Snow 103 (DM)Injured over 1,300, Destroyed over 5,800, Inundation over5,500

D: Dead number DM: The dead and missing number

*St.Herens volcanic eruption

https://disasterresearchnotes.site/archives/2860

**1980 Irpinia earthquake


Day_113 : World Disaster Chronology-1979

Date Place Disaster Type Situations
1979.01- US, East and others Cold wave The dead and missing is 60
1979.01.16 Iran, East Inland Earthquake M(not confirmed), The dead and missing number is 200
1979.02- Brazil, South Heavy rain, Flood The dead and missing number is 2,000
1979.02.20 IndonesiaJava Island Volcano disaster The dead and missing number is180
1979.03- India Heavy rain, Flood The dead and missing number is 230
1979.04.10 US , Middle Tornado The dead number is 59
1979.04.15 Montenegro, Albania and others Coast earthquake 1979 Montenegro earthquake M7.2,Dead and missing is150-200.Budva’s Old Town, one of Montenegro’s Cultural Heritage Sites, was heavily devastated. (Wikipedia) 
1979.04.29 Indonesia, WestSumatra Island Vulcano disaster The dead and missing number is 80.
1979.05- India Typhoon, Flood The dead and missing number is over 500
1979.06- Japan Heavy rain, Flood The dead and missing number is 29, Injured 50, House corruption approx. 200, inundation of over 48,000
1979.06- India Heat Wave The dead and missing is over 300.
1979.07.18 Indonesia Mudslide The dead and missing are over 900
1979.08- India Disease The dead are over 200
1979.08- Dominica Typhoon, Flood The dead and missing are 1,500
1979.09- Japan Typhoon, Flood The dead and missing is 12, Injured 80, Destroyed approx.1,500, inundation is over 68,000
1979.10- Japan Typhoon, Flood The dead and missing is 111, Injured 480, Destroyed 7,500, Inundations over 37,000
1979.12.12 Colombia Submarine Earthquake M7.6-8.1 Colombia Earthquake, the dead and missing 600.

※ The following 1979 Machchhu dam failure is a technological disaster. Therefore, the disaster is not included in the above chronology.
1979 Machchhu dam failure
“The Morbi dam failure was a dam-related flood disaster that occurred on August 11, 1979, in India. The Machchu-2 dam, situated on the Machhu river, burst, sending a wall of water through the town of Morbi in the Rajkot district of Gujarat. Estimates of the number of people killed vary greatly, ranging from 1800 to 25000 people (Wikipedia).”

Day_69(rev) : Disaster Information 3

Introduced you the following disaster information.
1) General info. 2) Database 3) Update info

1) General info is the first website to check.
1. UNISDR

unisdr

2) Database is the base to analyze the target disasters.
1. EM-DAT

emdat

2. Desinventar

disinventar

The disinventar is very accurate and detailed, however, the listed
countries are limited.

3) Update info. Is the website, we can check on a daily basis.
These are also useful to overview of the recent disasters.
1. ReliefWeb

reliefweb

2. ADRC

adrc

3. ROSE

ROSE

4. GDACS

GDACS

Concerning, data on demographic, socioeconomic, and others, we should
clarify the levels from national to local.

sponsored link

County Level
1. UN data

undata

2. World Bank open data

world bank data

3. CIA world factbook

world fact book

Provincial (States) Level
1. Government Office (National Statistics Office,etc.)

Community Level
1. Local Government Office
When we investigate the disasters, we firstly go to the ADRC (if the country is Asia) and Relief Web to see some significant numbers such as the death toll and affected numbers. Then, check the disaster history of the target areas by EM-DAT and Desinventar (if the country is listed). We also overview the county’s background by CIA world fact book and check some socio-economic data by UN or World bank open data. In addition, the local government or community data of the target area are significant to be accessed. These are the primary action to grasp the whole picture of the disaster.

Day_111 : Earthquake Information (1)

Introduce you two earthquake information websites. 1) The Earthquake Track 2) J-RISQ

1) The Earthquake Track

The Earthquake Track is useful to overview the earthquake occurrence situation in the world (Figure 1). As you can see in the below figure, every day’s earthquake occurrence situation such as how many times the earthquake occurred, what is the biggest earthquake of the day, and the earthquake locations on the map can be seen. Also, we can access to the detailed information of the quakes.

160831_earthquakepic1
Figure 1  The Earthquake Track

2) J-RISQ

Figure 2 shows J-RISQ provided by the National Research Institute for Earth Science and Disaster Prevention (NIED).

160831_JRISQ1
Figure 2  J-RISQ website

As you can see the Figure 2, this site does not only provide earthquake (hazard) information but also affected population estimation (exposure). In addition, the site gives us historical information of the affected area. You can also refer prediction data on the map such as earthquake distribution of 2% probability of exceedance in 50 years and distribution of return period of 50,000-year.

Day_110 : Bangladesh-Disasters, Lands, and Statistics (1)

Bangladesh has had a lot of cyclone disasters in the history. Table 1 indicates
the past cyclone disasters. Especially, we can see the 1970 and 1991’s cyclone
disasters are severe and caused many casualties.

Table 1 Cyclone disasters in Bangladesh*

banglacyclonehistory.

Table 2 picked up two disasters. We can compare the two. What can we say about this? The affected population was tremendously increased from 1970 to 1991. On the contrary,
the dead and missing number was decreasing. How about 1991’s cyclone disaster?

Table 2  1970 and 1991’s cyclone disasters*
banglacyclone19701991

Please check the dead and missing number and livestock damage.
You may have a strange feeling. The dead and missing number is
so rough.  However, livestock damage number is so precise. This
could reflect the cultural and social backgrounds.

The 1991 cyclone hit Sandwip island and Chittagong city. Figure 1
shows the map.

banglamap
Figure 1  Sandwip Island and Chittagong (Map source: Microsoft Group)

To be continued…….
*Table 1 and 2 ‘s source will be mentioned later.

Related books and info. for further understanding


sponsored link

Day_109 : Earthquake disasters in Thailand

The earthquake disaster is not so common in Thailand, therefore, that is why Thai people should consider the risk. They have a lack of experience.

The Earthquake Track is one of the useful websites to check the earthquakes in Thailand including neighboring countries. The recent earthquake can be confirmed
Recent Earthquakes Near Thailand” site.

The below is a guide book for earthquake disaster reduction in Thai (especially for Thai people).
A Guide Book for Earthquake Disaster Reduction (Thai language)

There are some active faults in Thailand (Figure 1).

thai faultline
Figure 1 Active Fault Map in Thailand

We should know the BKK is one of the earthquake vulnerable areas because the
ground is not so firm.
A short essay about natural disaster risk mapping in Thailand was written as follows:

https://disasterresearchnotes.site/archives/2935

Day_108 : World Disaster Chronology-1978

The chronology will be improved little by little. This is the first draft version. The information source will be shown later. In addition, other some events will be explained.

Date Place Disaster Type Situations
1978.01- US, East Cold wave The dead and missing number is 160
1978.02- US Disease Influenza, the dead number is over 6,000
1978.04.16 India Tornado The dead and missing number is over 600
1978.06.12 Japan, Northeast Submarine Earthquake 1978 Miyagi ken Oki earthquake M7.4, The dead number is 28
1978.07- Bangladesh Heavy rain, Flood The dead and missing number is over 120
1978 Pakistan Heavy rain, Flood The dead and missing number is over100
1978.08- India Heavy rain, Flood The dead and missing number is 900-1,300
1978.09- Africa, East Disease The dead number is over 350
1978.09.16 Iran, Central Inland Earthquake 1978 Tabas earthquake*  M7.2-7.8, The dead and missing number is 18,000-25,000
1978.10- India Disease The dead number is over 480
1978.11- Sri Lanka, and others Typhoon, Flood The dead and missing is 1,500

*1978 Tabas Earthquake

The one of the most earthquake vulnerable countries in Asia is Iran. Iran had 16 times earthquakes in the 1800s  and 18 times earthquakes in the 1900s which caused over 1000 deaths. In particular, the one of the main causes of deaths is a building structure, called adobe.

Adobe is a kind of clay used as a building material, typically in the form of sun-dried bricks (Oxford dictionaries).

In dry climates, adobe structures are extremely durable, and account for some of the oldest existing buildings in the world. Adobe buildings offer significant advantages due to their greater thermal mass, but they are known to be particularly susceptible to earthquake damage if they are not somehow reinforced. Adobe are common throughout the world such as Middle East, West Asia, North Africa, West Africa, South America, southwestern North America, Spain, and Eastern Europe (Wikipedia).

“Adobe and earthquakes are a perverse and tragic combination”
“The people on the street are killed by the walls that fall out, the people inside are killed by the roof that falls in”  says Mr Marcia Blondet (A Peruvian engineer). (BBC).

Day_106 : Myanmar-This week’s earthquake and the past trends

Myanmar had a huge earthquake (M6.8) on 24Aug2016.
The outline of the information can be checked by the ADRC website (Figure 1).

Myanmar Earthquake
Figure 1  Myammar Earthquake 24Aug2016 (ADRC)

“A powerful 6.8 magnitude earthquake struck central Myanmar, killing at least three people and damaging nearly 200 pagodas in the famous ancient capital of Bagan. The quake was also felt across neighboring Thailand, India and Bangladesh, sending panicked residents rushing onto the streets (AFP).”

Let’s check the disaster data.
The Figure 2 Figure 3 are the 1900-2016 top 10 deadliest and costliest disasters  in Myanmar (EM-DAT).

Myanmar death toll 2
Figure 2 Totals Deaths (Top 10 deadliest natural disasters in Myanmar)

Myanmar economic damage 2
Figure 3 Total damage (Top 10 costliest natural disasters in Myanmar)

We can confirm how the 2008 Cyclone Nargis was influential.
Many natural disasters which have high total deaths numbers occurred before 2000 (7/10).  On the contrary, many high economic damage natural disasters hit after 1990 (8/10).  These facts support the following “disaster is from human suffering to economic damage with development process”.

The notes on the recent major events (ADRC) are as follows:

1) Cyclone Nargis (May 2008)
Cyclone Nargis hit Myanmar in May 2008 which killed 84,537, with the missing 53,836, injured    19,359. 450,000 houses were destroyed, with another 350,000 damaged. Total affected people     were 2.4 million. The total economic loss was US$ 4.1 billion (according to Post-Nargis Joint         Assessment- PONJA).

2) Indian Ocean Tsunami (December 2004)
Indian Ocean Tsunami occurred off the Sumatra Island on 26 December 2006 killed 61,                 injured 42, affected 2,592 and destroyed 601 houses in Myanmar.

*The numbers of deaths are not the same with different sources. This is the one of the most important challenges of disaster research.

We can especially consider the political conditions for understanding the 2008 Cyclone Nargis disaster exacerbations. During the disaster, the county had refused international aids.

[ad#ads1]

Day_105 : Relocations or Rebuildings (2)


http://disasters.weblike.jp/disasters/archives/2950

After the 1896 Meiji sanriku tsunami, many communities considered relocating to higher grounds, however, a few communities could proceed the relocations. The main reasons why they could not relocate to higher grounds are the followings (Nakasu et al., 2011):

1) It was very inconvenient for them to settle the areas which were far from the sea because they were mainly fishermen or living their daily lives by the sea.

2) Most of them were doing small size fishing related businesses, had not enough budgets to relocate.

3) There were difficulties to attain the agreements to do relocations among the community members.

4) They, community members, had conflicts with land owners to select and purchase the relocation lands.

5) There were technical limitations to create a land for living on the slope because Japan did not have enough technological level at that time.

They mainly relocated to higher grounds by their own decisions. However, some groups gave pressures on the people who had planned to move and tried to let them give up to do so because they would like to maintain the communities to recover.

A small number of the communities moved to higher grounds, however, some went back to their original places. In addition, their relatives or other village people started to live there. Some families positively accepted the immigrants from outsides to maintain their ownerships.

Finally, almost all communities had chosen to rebuild at the same places, so the risks were retained and this combined with the fact that they were re-affected by the 1933 Showa sanriku tsunami disaster.

Concerning after the 1933 Showa sanriku tsunami, this will be explained later.

Day_104 : Lessons from a Japanese Environmental Movement- The Matsumura Research Group (2)

Mishima Numazu Shimizu (MNS) environmental movement in 1963-1964 is the turning point of a Japanese environmental history. The core of the movement is the science-based issues, especially, The Environmental Impact Assessment conducted by the Government Research Group and the Local Research Group.

https://disasterresearchnotes.site/archives/2981

Proposed the Development Plan

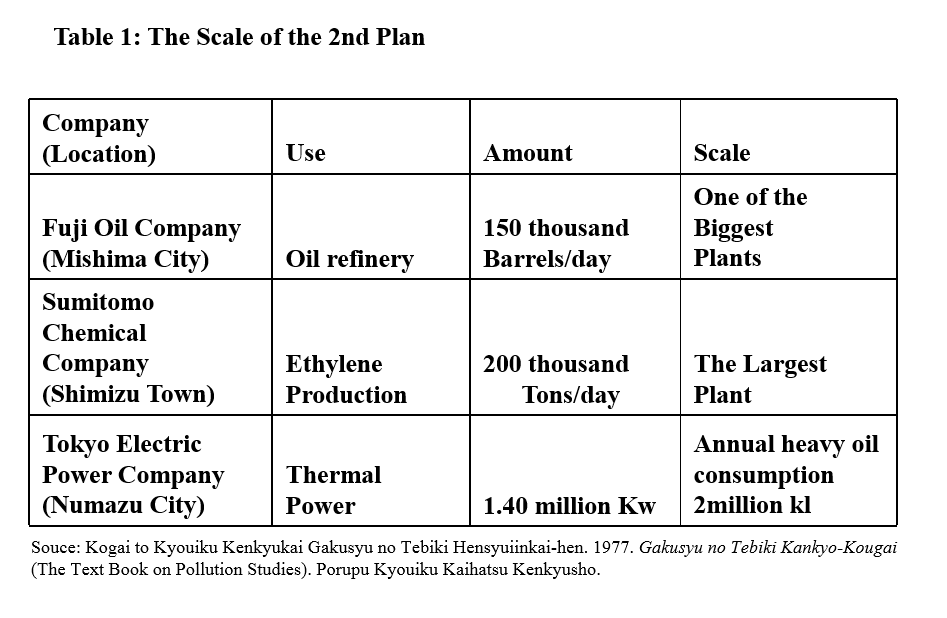
The below Figure 1 and Table 1 indicate the proposed development plan. These are the companies which had planned to come to the area. You can also see the scale of the plan.

planned project MNS
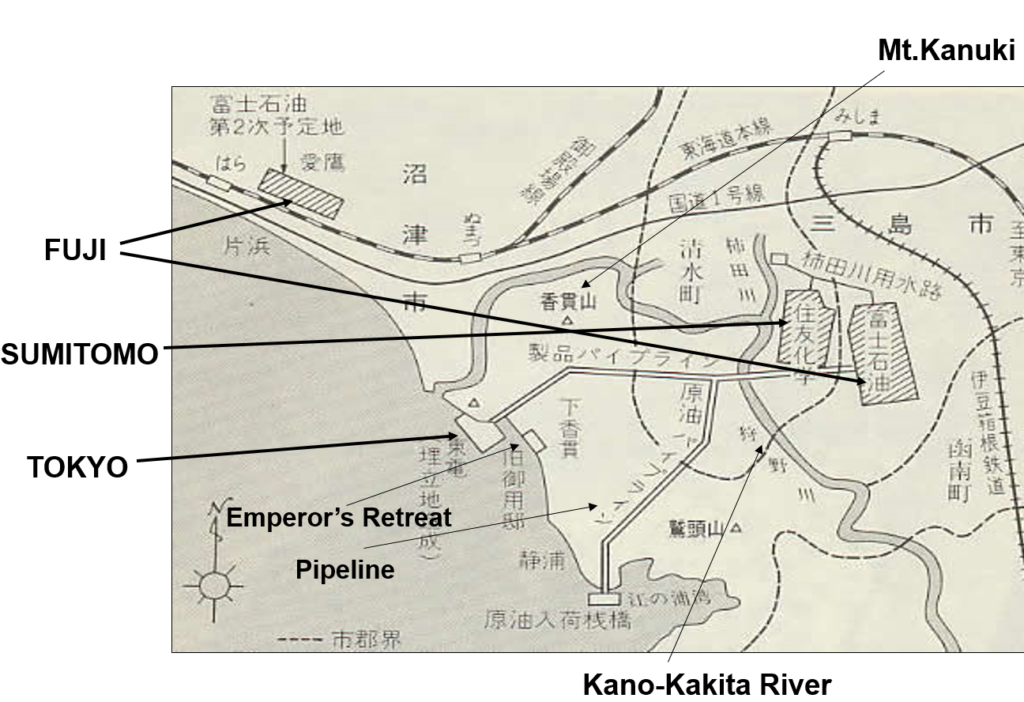
Figure 1  Proposed an Industrial Complex Plan

Table 1 The Scale of the Plan

The planned MNS

What is the MNS Movement?
The following two factors can be highlighted to explain the MNS movement. The first, the survey carried out by students (KOINOBORI research). The second, a few hundred education programs (mainly for local citizens)

In regard to the student survey, the survey carried out by students of Numazu Technical High School consists of three types by using local materials which were KOINOBORI, empty bottles and thermometers. The KOINOBORI were used in the air current survey that was conducted by about 300 students. The students made some air current maps that showed that the government’s appraisal of wind direction was incorrect. These maps gave decisive data to the Matsumura research group. Empty bottles were used for the water current survey. Thermometers enabled the students to make some maps showing the variation of temperatures.

On the other hand, the results of the survey reported by students of East Numazu High School which were called “Petrochemical Complex Project in Numazu and Mishima Area” was conducted by a Local Research Club. They researched it by using social scientific methods (including the survey in Yokkaichi City). The MNS activists use this report.

With reference to the education programs, many education programs were conducted by Numazu Technical High School teachers. They were held at schools, at the town halls and in the streets. Because of the programs, local citizens (including farmers and fishermen) became eager to learn. Local citizens wanted to know what was going on in their locality.

The Students Participatory Survey

The following Figure 2  shows the wind directions are from the sea to the land. This map was created by the students during the Koinobori time. This means the local people would be influenced by the pollutions from the planned factories. However, the government survey appealed the different ways.

Wind directions student survey
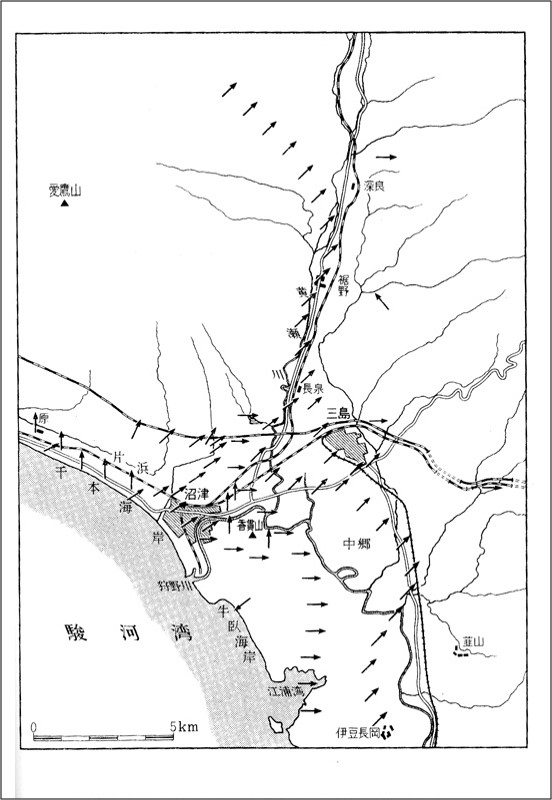
Figure2  Wind directions survey conducted by high school students
(Source :  Mitsuo Taketani, 1967)

The Kurokawa Research Group (Gov. Research group) carried out the first largest ever Environmental Impact Assessment (EIA) by the Japanese government in 1964. The representative was Dr.Masatake Kurokawa and the staff consisted of national academics. The budget was about 20 million yen (about 180,000 USD) at that time. The research was carried out by using helicopters and high-tech machines. The Kurokawa Research Group was nominated by the Minister of International Trade and Industry and the Minister of Public Health.

On the other hand, the Matsumura Research Group carried out the EIA by getting the cooperation of local people, including high school students. The representative was Dr.Seiji Matsumura and the staff consisted of two researchers with international experience and local high school teachers (Table 2). The budget was about 100 thousand yen (about 900 USD) at that time. The research was conducted using readily available materials and low-tech manpower (for example, Koinobori research). It meant that research people, as well as the local people and high school students, used their own ideas. The Matsumura research group was nominated by the Mayor of Mishima city, Mr.Taizo Hasegawa. They use students, local materials, and Japanese culture.

Table 2 Matsumura Research Group

local research group members
* I have life stories about them by interview surveys

The Formation of the Matsumura Research Group

The following is the formation process of the Matsumura Research Group. The National Institute and the Local high school have bonded together. These make ‘Think globally, act locally’.

  1. Education Seminar about Pollution Held by Two High School Teachers and a Professor
  2. Explanation of the Estimated Pollution Levels Given to the NIG (National Institute of Genetics) by Mr.Nagaoka and Mr.Nishioka (Teachers)
  3. Decided by the NIG Members to Refuse the Petrochemical Complex Plan
  4. Advice Given to Mishima City’s Mayor (Hasegawa) from the NIG Members to Establish the Research Committee for EIA
  5. Decision by Hasegawa to Reject the Proposed Petrochemical Complex
  6. Acceptance of Numazu Technical High School and NIG to do EIA in the Area

To be continued.