The accuracy will be improved with citing some data sources.
| Date | Place | Disaster Type | Situations |
| 1989.01 | USSR, Central (Tajikistan) | Inland Earthquake | M5.3, Over 270(DM) |
| 1989.04.20 | China | Hail Damage | Over 150(DM) |
| 1989.04.26 | Bangladesh | Tornado | The Daulatpur–Saturia Bangladesh tornado*.1300(D)The deadliest tornado disaster in history. |
| 1989.05- | Viet Nam | Tropical Storm, Flood | Over 740(DM), Tropical Storm Cecil |
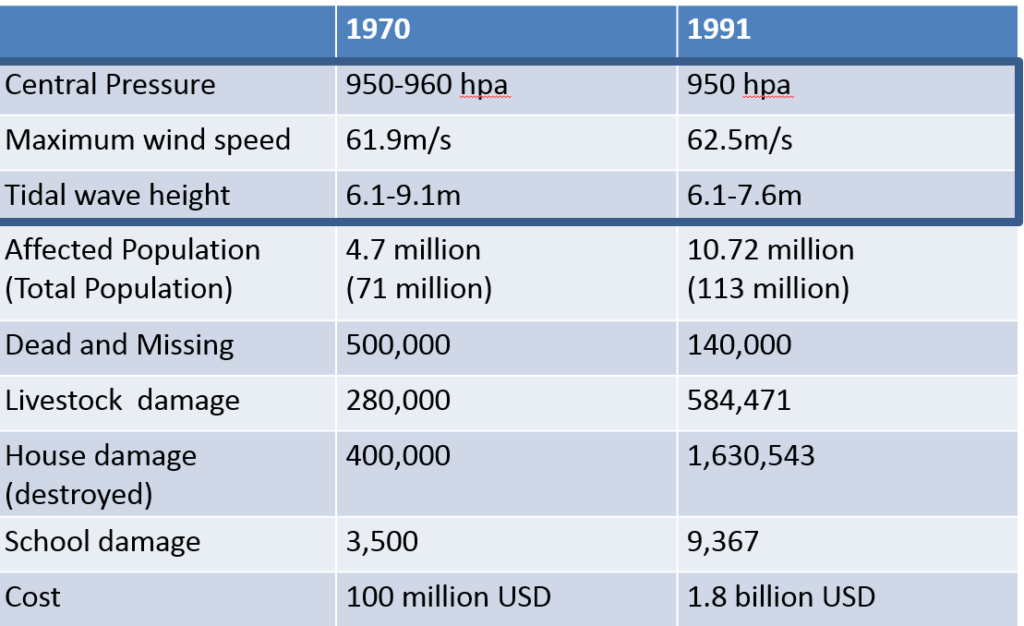
| 1989.05- | Bangladesh | Cyclone, Flood | Over 200(DM) |
| 1989.06- | China Sichuan | Torrential Rains, Flood | Over 1,300(DM) |
| 1989.06- | Sri Lanka | Torrential Rains, Flood | 300-500(DM) |
| 1989.07- | India | Cyclone, Flood | Over 2,700(DM) |
| 1989.07- | China | Torrential Rains, Flood | Over 1,500(DM) |
| 1989.07- | Bangladesh | Torrential Rains, Flood | Over 200(DM) |
| 1989.07- | Viet Nam | Typhoon, Flood | Over 200(DM) |
| 1989.08.01 | Iran, West | Inland Earthquake | M5.8, 120(DM) |
| 1989.09- | China | Typhoon, Flood | Over 520(DM) |
| 1989.10.17 | US, West (Calfornia) | Inland Earthquake | Loma Prieta earthquake **(M7.1) 62(DM), Damage cost 7bill.US |
DM: The number of dead and missing.
*The Daulatpur–Saturia, Bangladesh tornado occurred in the Manikganj District, Bangladesh on April 26, 1989. There is great uncertainty about the death toll, but estimates indicate that it killed around 1,300 people, which would make it the deadliest tornado in history. The disasters in Bangladesh indicate natural disaster is not natural. Can refer Day_117.
http://disasters.weblike.jp/disasters/archives/3224
**The 1989 Loma Prieta earthquake occurred in Northern California on October 17 at 5:04 p.m. local time. This earthquake happened in the northeast of Santa Cruz on a section of the San Andreas Fault.The death toll was relatively not high compared to the economic damage. This can be explained with developed countries, especially US disasters characteristics. Can refer to The Day_119.
http://disasters.weblike.jp/disasters/archives/3248


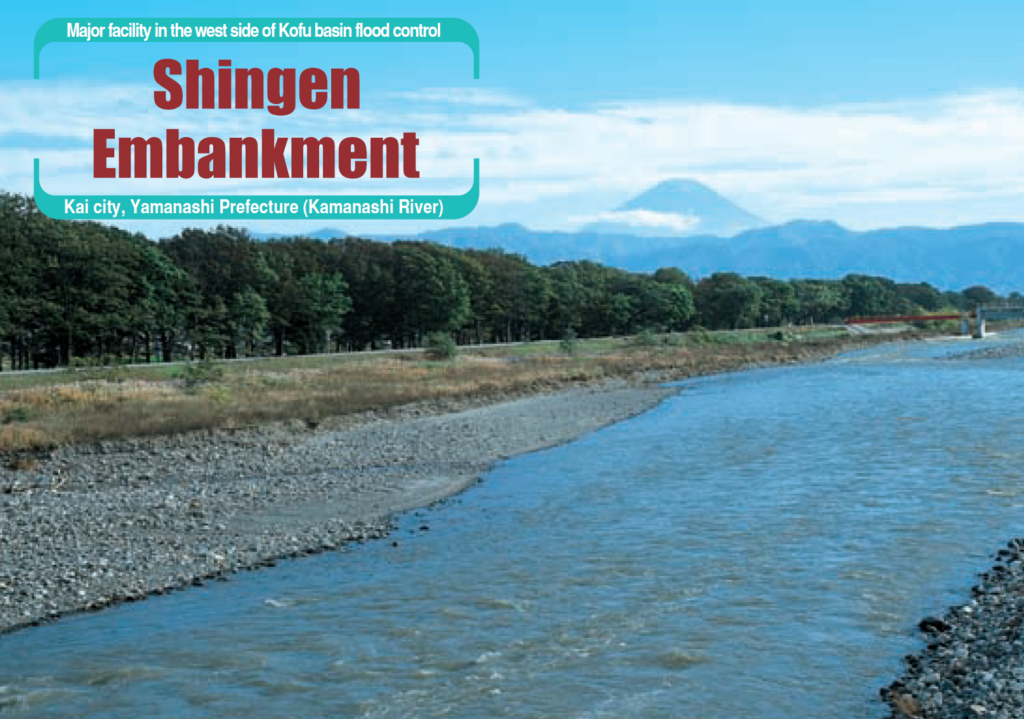 Figure: Shingen Embarkment**


 .
.