>>>>>>>>>>>>>>>>>>>>>>>>>>>>
Date and time
7 May 2006
Visit
New Orleans Homeland Security and Public Safety Office
(New Orleans City Office of Homeland Security and Public Safety )
Interviewee
Colonel and Director
Subject
Hurricane Katrina Disaster Response
>>>>>>>>>>>>>>>>>>>>>>>>>>>>>>>
https://disasterresearchnotes.site/archives/3002
There are three drainage canals in New Orleans. There is also a pump station for each. Since New Orleans is below sea level, water is constantly pumped from these pump stations and drained into Lake Pontchartrain.
The breakwater was corrupted by the storm surge. The water was flowing into the canal from the lake, and at the same time, the pump station had the maximum pressure with the water. The pumps were broken and became not-functioned.
After the hurricane, there was only one evacuation route that crossed the bridge over Mississippi. However, the route had been blocked. These also affected support activities.
<Measures for breakwater>
At present, the Corps of Engineers will set a lock at the entrance of the canal and close them to prevent water from flowing into the canal since this year.
The challenge from this year is the evacuation of West Bank citizens. Because the levees are weak, hurricanes can easily break them.
The levee can be effective this year, but the problem is that in the next two years, the pump station will have insufficient capacity to pump water.
< Future measures of the city >
The following three goals are set as future measures. First, leave no one in the shelter. Second, the city will assist those who have no access to evacuation. Third, improve the safety of city facilities and property before and after the disaster.
Another important point this year is to let all citizens evacuate two days before Hurricane hit. The challenge is the reality that many people would not try to evacuate. As a background, the levee is to be broken, needs to have a terrible situation imagination.
There is a plan to install floodgates in a wide range of wetlands in eastern New Orleans to prevent storm surges.
Political challenge, New Orleans, including the peripheral has originally 100 million people, was an energy supply base, there is a tremendous national influence, the people here have to work.
As a countermeasure, the city has provided a wireless system. The system had been unavailable after the Hurricane.
A radio station in City Hall as a countermeasure against rumors which had become a social issue during Katrina was set up to keep media members staying and unifying the correct information.
Related information
The NIED team went to New Orleans and Missippi coastal areas to investigate.
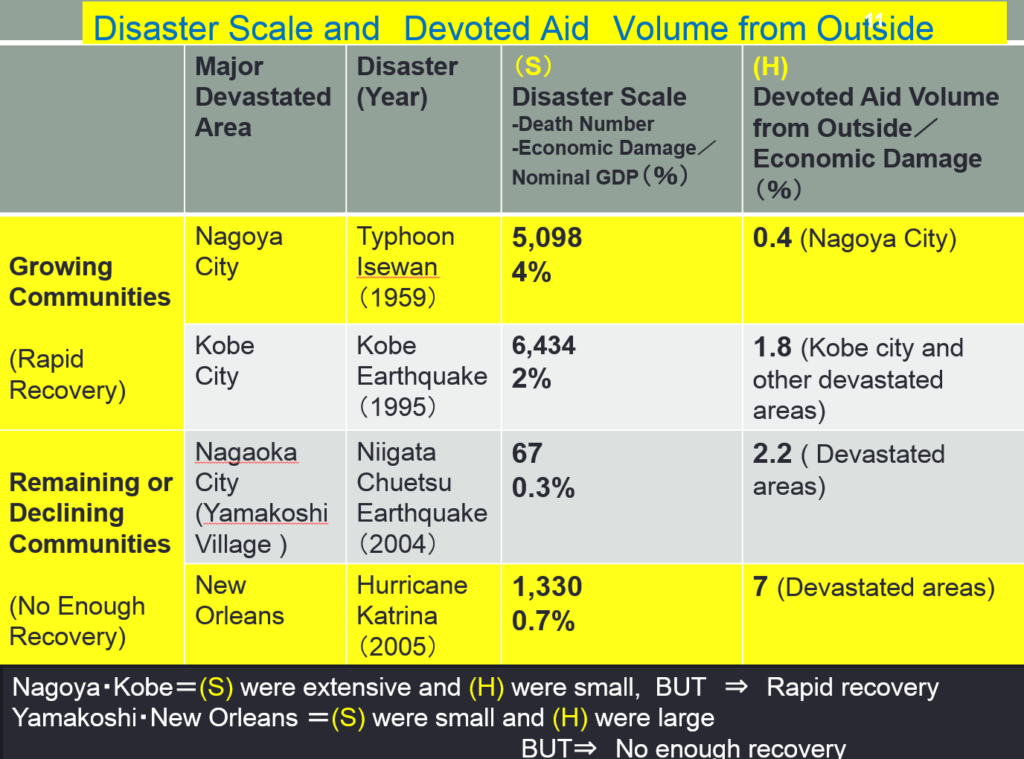
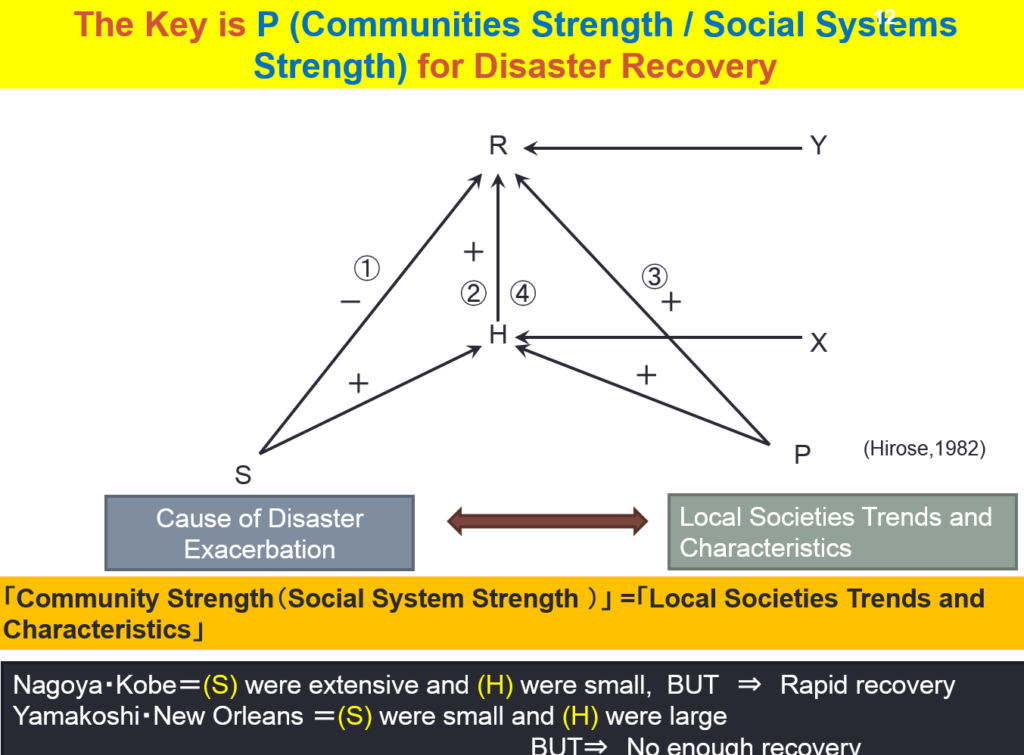
Characteristics of the 2005 Hurricane Katrina Disasters
The community data center is the best to investigate to grasp the trend by using stats.
https://disasterresearchnotes.site/archives/2975