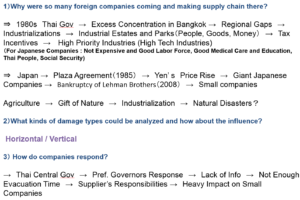
Continue to explain the chain reactions of economic damage caused by Chao Phraya river flood. There were horizontal and vertical damage exacerbations types.
Concerning the horizontal damage exacerbations, we sometimes neglect indirect severe impacts caused by disasters. However, in this global world, economic activities are connected each other and so do the impacts. The following Figure 1 shows the three types of disaster exacerbations for example. The first category is “All or most factories of one’s own as well as those of partners suffer serious flood damage”. This category is the severest. The second category is “One’s factories suffer serious damage, but partners suffer no or light damage”. The third category is “One’s factories suffer no or light damage while partners suffer serious damage”. However, if the one’s factory totally relies on the partners which are affected by the disaster could have a very serious impact.
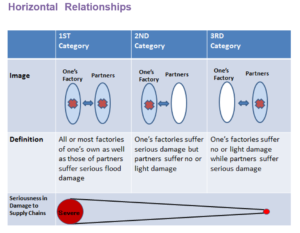
Figure 1 Damage types and severities (Horizontal)
With respect to the vertical damage exacerbation, the key word is the suppliers’ responsibility. For example, a big major car company has the responsibility for customers to supply cars, subcontractors have the responsibility for the car company to supply the parts, sub-subcontractors have the responsibility for the subcontractors to supply the parts of the parts, sub-sub-subcontractors have the responsibility for the sub-subcontractors to supply the parts of the parts of the parts, and so on. The numbers of the companies become larger along with this vertical pyramidal structure. However, their resources are opposite as mentioned in Figure 2. Industrial estates and parks ordered the evacuation for the companies very slowly at that time of the flood because of some reasons (The reasons will be explained). However, the big companies continued their activities until the time, so sub and sub-sub and sub-sub-sub contractors could not evacuate until the bigger (upstream) companies’ evacuation decision making because of the supplier’s responsibilities. The big companies could evacuate so fast and effectively. They have the resources to do so. However, smaller companies could not evacuate so fast because they needed to wait until the bigger company’s evacuation decision and they tended to have limited resources along with the structure. They, for instance, could not move heavy machines to the upper floors. They did not have enough employees, systems, or plans to do so.
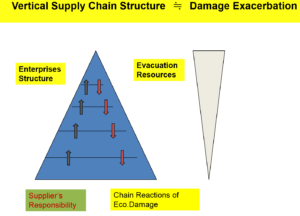
Figure 2 Damage types and severities (Vertical)
These are the outlines of the disaster damage exacerbation of the supply chains. These are presented at several meetings in Japan.


 .
.