Category Archives: Hurricane

Day_160: Interview Report: Hurricane Katrina Response (1)

Now I am digging up my past experience. The report is a part of the project.

The below past article can be checked for your reference.

https://disasterresearchnotes.site/archives/2975

>>>>>>>>>>>>>>>>>>>>>>>>>>>>>>>>>>>>>>>>>>>>>>>>>>>

Date and time
7 May 2006

Visit
New Orleans Homeland Security and Public Safety Office
(New Orleans City Office of Homeland Security and Public Safety )

Interviewee
Colonel and Director

Subject
Hurricane Katrina Disaster Response

>>>>>>>>>>>>>>>>>>>>>>>>>>>>>>>>>>>>>>>>>>>>>>>>>>

<Contents>
< Work >
The interviewee: Responsible for the Police, fire, EMS (emergency medical services),
and crisis management of cooperation with state, federal and city

< The lessons of Katrina >
The lesson learned is, “We can not rely on external resources. Without relying on the federal (country) government, each person should think they need to protect themselves.” (This is the interview record.)

<Hurricane Katrina-What Happened>
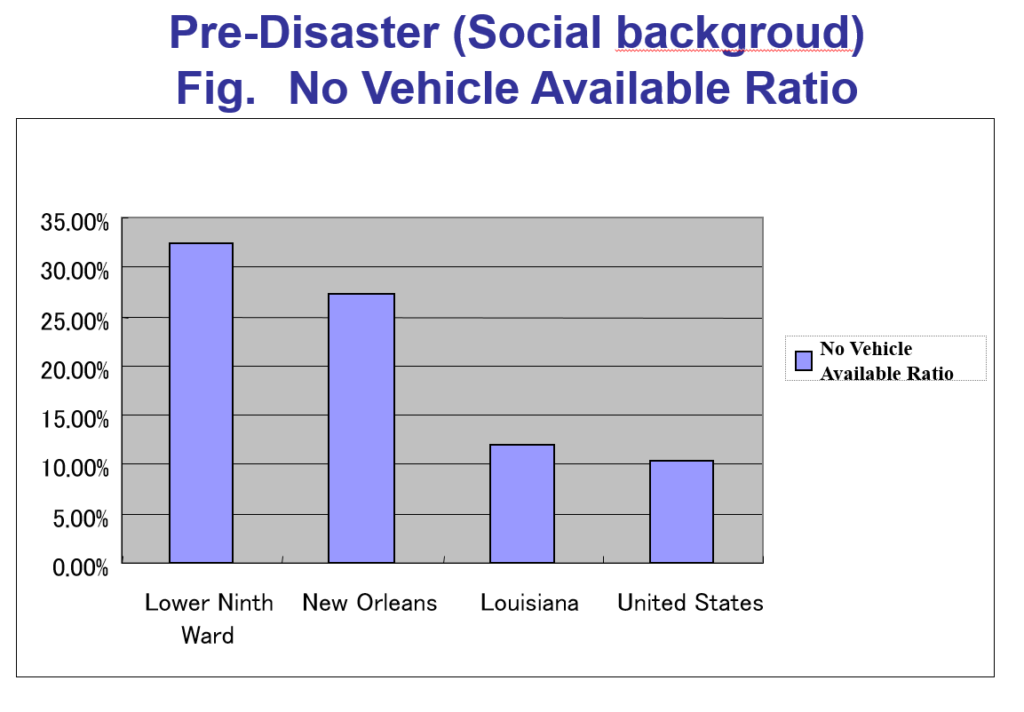
Before Friday (8/26), all the state government was setting evacuation preparation. FEMA staff deployed throughout the city. Eighty percent of citizens evacuated on their own, but many of the rest were unable to evacuate with no means.

The city, about 15,000 civilians, were provided transportation means to be saved in the shelter. Besides, before hurricane landfall on Sunday(8/28), the people in the city who can not evacuate evacuated to Super Dome.

Since the federal government does not permit having a shelter in New Orleans, New Orleans is the only city ​​in the U.S. that does not have a shelter. The Federation and the Red Cross had considered the situation as a dangerous task because of this.

When the hurricane comes, Super Dome became a temporary shelter.

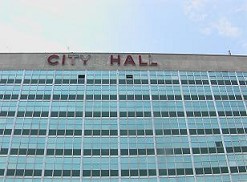
Picture: New Orleans City Hall (on 7 May 2006)

After the hurricane, we had a tough week. After all, approximately 700 people of citizens lost their lives.

Day_103 : New Orleans and Hurricane Katrina in 2005

Day_100 indicated a human suffering exacerbation process in New Orleans during the 2005 Hurricane Katrina.

http://disasters.weblike.jp/disasters/archives/2975

The Figure 1 again shows the relationships between the human suffering exacerbation process and social backgrounds with data. Table 1 also indicates the estimated death numbers in some wards.

exacerbation2
Figure 1 Human Suffering Exacerbation Process and Social Background

Table 1 Found Dead Bodies in New Orleans

dead in neworleans

The total views are indicated in the following Figure 2, 3, 4, and Table 2.
Concerning the population change, New Orleans is the one of the decreasing communities in US. For example, rapid urbanization related matters caused environmental degradation before the disaster. Campanella(2004)mentioned New Orleans became not a sustainable, but a survival city. The lower 9th ward, for example, with regard to the ethnicity, we can see the high black and the African American proportion.  With respect to Income, we can also identify the people living in the Lower 9th ward have lower incomes.

NOLApopulation
Figure 2  Population Change Louisiana( Light Blue ) and New Orleans (Dark Blue)


2000census
Figure 3 Percent Black or African American, 2000 (Census, 2000)

pop and ethnicities
Figure 4 Percent Black or African American and White
(Source: Congressional Research Service)

Table 2 People’s Income in both New Orleans and Lower 9th Ward

income katrina

These are referred by an NIED publication.

Day_100 : A Human Suffering Exacerbation-Data from Greater New Orleans Community Data Center

The Greater New Orleans Community Data Center (GNOCDC) website was found after the field survey on Hurricane Katrina in Louisiana and Mississippi in 2005. I was so amazed. This is the one of the demographers great contributions to disaster research.

The site provides the information of the pre-Katrina situations by parish and also by ward. This is very useful to examine the social backgrounds of the areas in detail.

gnocdcPrekatrina
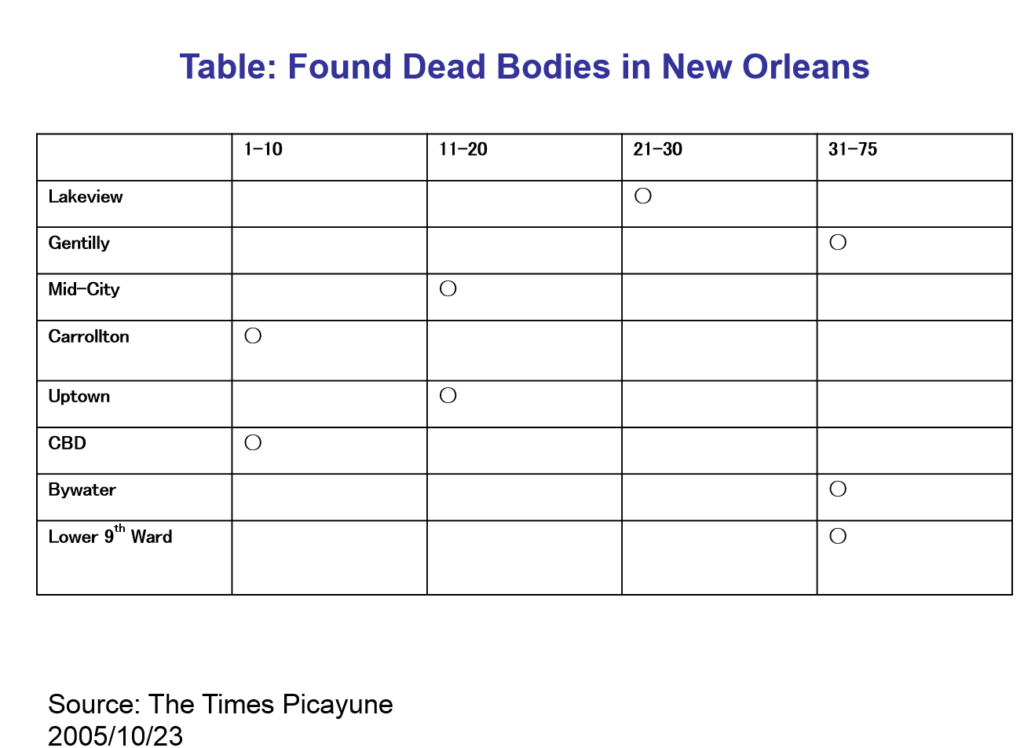
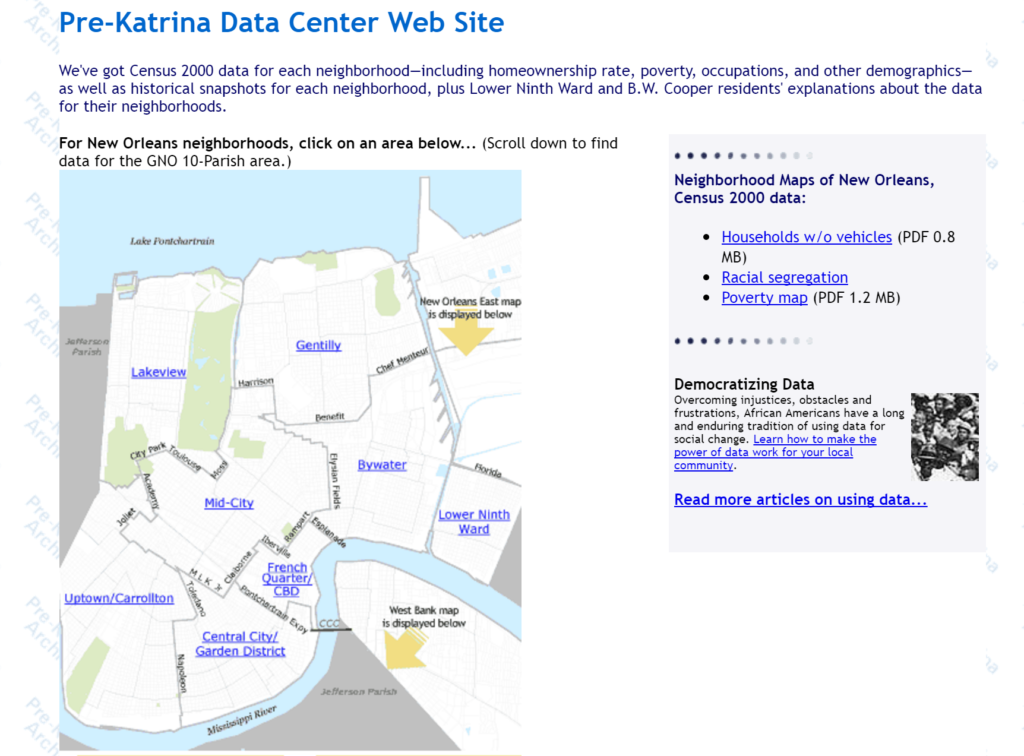
Figure 1 GNOCDC (Pre-Katrina data site)

The paper on Karina disaster using these data is to explain how human sufferings were exacerbated by the stage with the social background as shown in Figure 2 (Nakasu, 2006 :Sorry in Japanese, however, summary and figures are in English).

human suffering
Figure 2 Victimization Process

exacerbation2
Figure 3
Victimization Process by Stage

Table 1 Found Dead Bodies in New Orleans  

dead in neworleans

The process can be divided into five stages with time such as A) Pre-disaster B) Direct damage C) Social disorder D) Life environment  E) Reconstruction and recovery. Then, these are examined with the social background data (Figure 3).

For example,  1) Pre-disaster stage, I picked up an evacuation aspect to explain the social background of this stage.

Using the GNOCDC database, I could check the possession ratio of the vehicle in some areas.

novehicle
Figure 4 No Vehicle Available Ratio (GNOCDC)

Table 1 and Figure 4 show the people in Lower 9th ward, one of the most severely affected areas, had a low possession ratio of the vehicle. This can explain so many residents needed to have government help to evacuate and they could not evacuate before the Hurricane hit.

The general social background, such as ethnic groups, household incomes, and others with other stages of examinations will be discussed later.


The Great Deluge: Hurricane Katrina, New Orleans, and the Mississippi Gulf Coast (English Edition)

Day_77 : Historical trends of the damages caused by natural disasters

The damages caused by natural disasters are from human to economy with the development. This is one of the universal and historical trends in the world and within the countries. Mortality numbers of natural disasters tend to be decreasing with national development, but economic losses are the opposite. This is because of urbanization, science and technology advancement, asset values, and so on. This is the same as developing and developed countries’ relationships. Developing countries tend to have high mortality numbers, on the other hand, developed countries are inclined to have high economic losses.

The following tables (little bit old, sorry) which I used to research on Hurricane Katrina in 2005. What you can say about these?

table1

table2

Yes, table 1 indicates almost all high mortality numbers hurricane disasters in the United States are before 1960. On the contrary, table 2 shows almost all high-cost hurricane disasters are after 2000.

sponsored link

Day_16 : GNOCDC

The Greater New Orleans Community Data Center (GNOCDC) website was found after the field survey on Hurricane Katrina in Louisiana and Mississippi in 2005. I was so amazed. This is one of the demographer’s great contributions to disaster research.
The site has the following:
http://www.datacenterresearch.org/pre-katrina/prekatrinasite.html

The site provides information on pre-Katrina situations in a parish. This is very useful to examine the social backgrounds of the areas in detail.
I wrote the paper by using these data to explain how human suffering was exacerbated by social backgrounds (sorry in Japanese; however, the summary and figures are in English).
http://dil-opac.bosai.go.jp/publication/nied_natural_disaster/pdf/41/41-05.pdf